PNC Bank 2011 Annual Report Download - page 94
Download and view the complete annual report
Please find page 94 of the 2011 PNC Bank annual report below. You can navigate through the pages in the report by either clicking on the pages listed below, or by using the keyword search tool below to find specific information within the annual report.-
 1
1 -
2
-
3
-
4
-
5
-
6
-
7
-
8
-
9
-
10
-
11
-
12
-
13
-
14
-
15
-
16
-
17
-
18
-
19
-
20
-
21
-
22
-
23
-
24
-
25
-
26
-
27
-
28
-
29
-
30
-
31
-
32
-
33
-
34
-
35
-
36
-
37
-
38
-
39
-
40
-
41
-
42
-
43
-
44
-
45
-
46
-
47
-
48
-
49
-
50
-
51
-
52
-
53
-
54
-
55
-
56
-
57
-
58
-
59
-
60
-
61
-
62
-
63
-
64
-
65
-
66
-
67
-
68
-
69
-
70
-
71
-
72
-
73
-
74
-
75
-
76
-
77
-
78
-
79
-
80
-
81
-
82
-
83
-
 84
84 -
 85
85 -
 86
86 -
 87
87 -
 88
88 -
 89
89 -
 90
90 -
 91
91 -
 92
92 -
 93
93 -
 94
94 -
 95
95 -
 96
96 -
 97
97 -
 98
98 -
 99
99 -
 100
100 -
 101
101 -
 102
102 -
 103
103 -
 104
104 -
105
-
106
-
107
-
108
-
109
-
110
-
111
-
112
-
113
-
114
-
115
-
116
-
117
-
118
-
119
-
120
-
121
-
122
-
123
-
124
-
125
-
126
-
127
-
128
-
129
-
130
-
131
-
132
-
133
-
134
-
135
-
136
-
137
-
138
-
139
-
140
-
141
-
142
-
143
-
144
-
145
-
146
-
147
-
148
-
149
-
150
-
151
-
152
-
153
-
154
-
155
-
156
-
157
-
158
-
159
-
160
-
161
-
162
-
163
-
164
-
165
-
166
-
167
-
168
-
169
-
170
-
171
-
172
-
173
-
174
-
175
-
176
-
177
-
178
-
179
-
180
-
181
-
182
-
183
-
184
-
185
-
186
-
187
-
188
-
189
-
190
-
191
-
192
-
193
-
194
-
195
-
196
-
197
-
198
-
199
-
200
-
201
-
202
-
203
-
204
-
205
-
206
-
207
-
208
-
209
-
210
-
211
-
212
-
213
-
214
-
215
-
216
-
217
-
218
-
219
-
220
-
221
-
222
-
223
-
224
-
225
-
226
-
227
-
228
-
229
-
230
-
231
-
232
-
233
-
234
-
235
-
236
-
237
-
238
 |
 |
Our modeling methods and data are reviewed by independent
model reviewers not involved in the development of the model
to identify possible errors or areas where the soundness of the
model could be in question. Issues identified by the
independent reviewer are tracked and reported using our
existing governance structure until the issue has been fully
remediated. It is important that models operate in a controlled
environment where access to code or the ability to make
changes is limited to those so authorized. Additionally, proper
back-up and recovery mechanisms are needed for the ongoing
functioning of models. Our use of independent model control
reviewers aids in the evaluation of the existing control
mechanisms to help ensure that controls are appropriate and
are functioning properly.
L
IQUIDITY
R
ISK
M
ANAGEMENT
Liquidity risk has two fundamental components. The first is
potential loss assuming we were unable to meet our funding
requirements at a reasonable cost. The second is the potential
inability to operate our businesses because adequate
contingent liquidity is not available in a stressed environment.
We manage liquidity risk at the consolidated company level
(bank, parent company, and nonbank subsidiaries combined)
to help ensure that we can obtain cost-effective funding to
meet current and future obligations under both normal
“business as usual” and stressful circumstances, and to help
ensure that we maintain an appropriate level of contingent
liquidity.
Spot and forward funding gap analyses are used to measure
and monitor consolidated liquidity risk. Funding gaps
represent the difference in projected sources of liquidity
available to offset projected uses. We calculate funding gaps
for the overnight, thirty-day, ninety-day, one hundred
eighty-day and one-year time intervals. Management also
monitors liquidity through a series of early warning indicators
that may indicate a potential market, or PNC-specific,
liquidity stress event. Finally, management performs a set of
liquidity stress tests and maintains a contingency funding plan
to address a potential liquidity crisis. In the most severe
liquidity stress simulation, we assume that PNC’s liquidity
position is under pressure, while the market in general is under
systemic pressure. The simulation considers, among other
things, the impact of restricted access to both secured and
unsecured external sources of funding, accelerated run-off of
customer deposits, valuation pressure on assets, and heavy
demand to fund contingent obligations. Risk limits are
established within our Liquidity Risk Policy. Management’s
Asset and Liability Committee regularly reviews compliance
with the established limits.
Parent company liquidity guidelines are designed to help
ensure that sufficient liquidity is available to meet our parent
company obligations over the succeeding 24-month period.
Risk limits for parent company liquidity are established within
our Enterprise Capital and Liquidity Management Policy. The
Board of Directors’ Risk Committee regularly reviews
compliance with the established limits.
Bank Level Liquidity – Uses
Obligations requiring the use of liquidity can generally be
characterized as either contractual or discretionary. At the
bank level, primary contractual obligations include funding
loan commitments, satisfying deposit withdrawal requests and
maturities and debt service related to bank borrowings. We
also maintain adequate bank liquidity to meet future potential
loan demand and provide for other business needs, as
necessary. As of December 31, 2011, there were
approximately $7.3 billion of bank borrowings with
contractual maturities of less than one year.
Bank Level Liquidity – Sources
Our largest source of bank liquidity on a consolidated basis is
the deposit base that comes from our retail and commercial
businesses. Liquid assets and unused borrowing capacity from
a number of sources are also available to maintain our
liquidity position. Borrowed funds come from a diverse mix
of short and long-term funding sources.
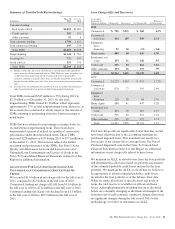
At December 31, 2011, our liquid assets consisted of short-
term investments (Federal funds sold, resale agreements,
trading securities, and interest-earning deposits with banks)
totaling $5.9 billion and securities available for sale totaling
$48.6 billion. Of our total liquid assets of $54.5 billion, we
had $20.1 billion pledged as collateral for borrowings, trust,
and other commitments. The level of liquid assets fluctuates
over time based on many factors, including market conditions,
loan and deposit growth and active balance sheet
management.
In addition to the customer deposit base, which has
historically provided the single largest source of relatively
stable and low-cost funding and liquid assets, the bank also
obtains liquidity through the issuance of traditional forms of
funding including long-term debt (senior notes and
subordinated debt and FHLB advances) and short-term
borrowings (Federal funds purchased, securities sold under
repurchase agreements, commercial paper issuances, and other
short-term borrowings).
PNC Bank, N.A. has the ability to offer up to $20 billion in
senior and subordinated unsecured debt obligations with
maturities of more than nine months. Through December 31,
2011, PNC Bank, N.A. had issued $6.9 billion of debt under
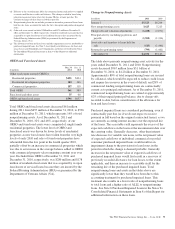
this program. Total senior and subordinated debt declined to
$4.1 billion at December 31, 2011 from $5.5 billion at
December 31, 2010 due to contractual maturities.
PNC Bank, N.A. is a member of the FHLB-Pittsburgh and as
such has access to advances from FHLB-Pittsburgh secured
generally by residential mortgage and other mortgage-related
loans. At December 31, 2011, our unused secured borrowing
capacity was $10.6 billion with FHLB-Pittsburgh. Total
The PNC Financial Services Group, Inc. – Form 10-K 85