PNC Bank 2011 Annual Report Download - page 169
Download and view the complete annual report
Please find page 169 of the 2011 PNC Bank annual report below. You can navigate through the pages in the report by either clicking on the pages listed below, or by using the keyword search tool below to find specific information within the annual report.-
 1
1 -
2
-
3
-
4
-
5
-
6
-
7
-
8
-
9
-
10
-
11
-
12
-
13
-
14
-
15
-
16
-
17
-
18
-
19
-
20
-
21
-
22
-
23
-
24
-
25
-
26
-
27
-
28
-
29
-
30
-
31
-
32
-
33
-
34
-
35
-
36
-
37
-
38
-
39
-
40
-
41
-
42
-
43
-
44
-
45
-
46
-
47
-
48
-
49
-
50
-
51
-
52
-
53
-
54
-
55
-
56
-
57
-
58
-
59
-
60
-
61
-
62
-
63
-
64
-
65
-
66
-
67
-
68
-
69
-
70
-
71
-
72
-
73
-
74
-
75
-
76
-
77
-
78
-
79
-
80
-
81
-
82
-
83
-
84
-
85
-
86
-
87
-
88
-
89
-
90
-
91
-
92
-
93
-
94
-
95
-
96
-
97
-
98
-
99
-
100
-
101
-
102
-
103
-
104
-
105
-
106
-
107
-
108
-
109
-
110
-
111
-
112
-
113
-
114
-
115
-
116
-
117
-
118
-
119
-
120
-
121
-
122
-
123
-
124
-
125
-
126
-
127
-
128
-
129
-
130
-
131
-
132
-
133
-
134
-
135
-
136
-
137
-
138
-
139
-
140
-
141
-
142
-
143
-
144
-
145
-
146
-
147
-
148
-
149
-
150
-
151
-
152
-
153
-
154
-
155
-
156
-
157
-
158
-
 159
159 -
 160
160 -
 161
161 -
 162
162 -
 163
163 -
 164
164 -
 165
165 -
 166
166 -
 167
167 -
 168
168 -
 169
169 -
 170
170 -
 171
171 -
 172
172 -
 173
173 -
 174
174 -
 175
175 -
 176
176 -
 177
177 -
 178
178 -
 179
179 -
180
-
181
-
182
-
183
-
184
-
185
-
186
-
187
-
188
-
189
-
190
-
191
-
192
-
193
-
194
-
195
-
196
-
197
-
198
-
199
-
200
-
201
-
202
-
203
-
204
-
205
-
206
-
207
-
208
-
209
-
210
-
211
-
212
-
213
-
214
-
215
-
216
-
217
-
218
-
219
-
220
-
221
-
222
-
223
-
224
-
225
-
226
-
227
-
228
-
229
-
230
-
231
-
232
-
233
-
234
-
235
-
236
-
237
-
238
 |
 |

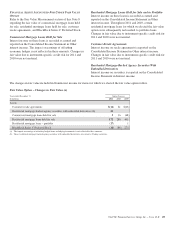
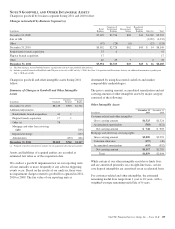
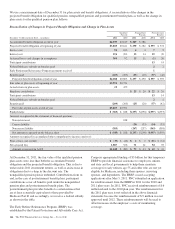
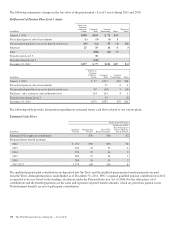
Amortization expense on existing intangible assets follows:
Amortization Expense on Existing Intangible Assets
In millions
2009 $326
2010 304
2011 324
2012 264
2013 203
2014 198
2015 183
2016 159
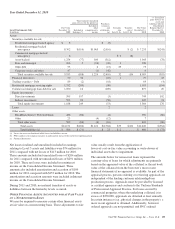
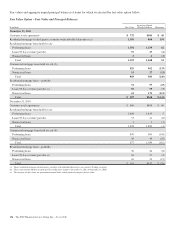
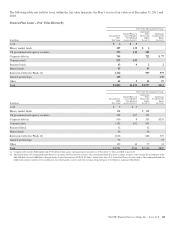
Changes in commercial mortgage servicing rights follow:
Commercial Mortgage Servicing Rights
In millions 2011 2010 2009
January 1 $ 665 $ 921 $864
Additions (a) 120 83 121
Acquisition adjustment 1
Sale of servicing rights (b) (192)
Impairment charge (157) (40) 35
Amortization expense (160) (107) (100)
December 31 $ 468 $ 665 $921
Valuation allowance:
January 1 $ (40) $ (35)
Provision (166) $(110) (1)
Recoveries 970 36
December 31 $(197) $ (40) $—
(a) Additions for 2011 included $55 million from loans sold with servicing retained and
$65 million from purchases of servicing rights from third parties. Comparable
amounts were $45 million and $38 million for 2010 and $92 million and $29 million
for 2009.
(b) Reflects the sale of a duplicative agency servicing operation in 2010.
We recognize as an other intangible asset the right to service
mortgage loans for others. Commercial MSRs are purchased
and originated when loans are sold with servicing retained.
Commercial MSRs are initially recorded at fair value. These
rights are subsequently accounted for at the lower of
amortized cost or fair value, and are substantially amortized in
proportion to and over the period of estimated net servicing
income of 5 to 10 years.
Commercial MSRs are periodically evaluated for impairment.
For purposes of impairment, the commercial MSRs are
stratified based on asset type, which characterizes the
predominant risk of the underlying financial asset. If the
carrying amount of any individual stratum exceeds its fair
value, a valuation reserve is established with a corresponding
charge to Corporate services on our Consolidated Income
Statement.
The fair value of commercial MSRs is estimated by using an
internal valuation model. The model calculates the present
value of estimated future net servicing cash flows considering
estimates of servicing revenue and costs, discount rates and
prepayment speeds.
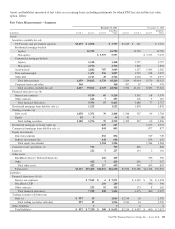
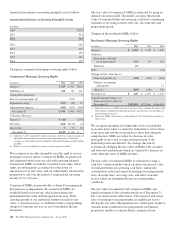
Changes in the residential MSRs follow:
Residential Mortgage Servicing Rights
In millions 2011 2010 2009
January 1 $ 1,033 $ 1,332 $ 1,008
Additions:
From loans sold with
servicing retained 118 95 261
Purchases 65
Sales (74)
Changes in fair value due to:
Time and payoffs (a) (163) (185) (264)
Purchase accounting
adjustments 17
Other (b) (406) (209) 384
December 31 $ 647 $ 1,033 $ 1,332
Unpaid principal balance of
loans serviced for others at
December 31 $118,058 $125,806 $146,050
(a) Represents decrease in MSR value due to passage of time, including the impact from
both regularly scheduled loan principal payments and loans that were paid down or
paid off during the period.
(b) Represents MSRs value changes resulting primarily from market-driven changes in
interest rates.
We recognize mortgage servicing right assets on residential
real estate loans when we retain the obligation to service these
loans upon sale and the servicing fee is more than adequate
compensation. MSRs are subject to declines in value
principally from actual or expected prepayment of the
underlying loans and defaults. We manage this risk by
economically hedging the fair value of MSRs with securities
and derivative instruments which are expected to increase in
value when the value of MSRs declines.
The fair value of residential MSRs is estimated by using a
cash flow valuation model which calculates the present value
of estimated future net servicing cash flows, taking into
consideration actual and expected mortgage loan prepayment
rates, discount rates, servicing costs, and other economic
factors which are determined based on current market
conditions.
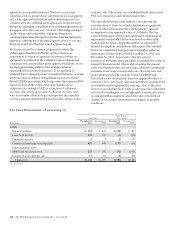
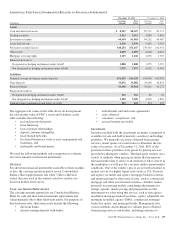
The fair value of residential and commercial MSRs and
significant inputs to the valuation model as of December 31,
2011 are shown in the tables below. The expected and actual
rates of mortgage loan prepayments are significant factors
driving the fair value. Management uses a third-party model to
estimate future residential loan prepayments and internal
proprietary models to estimate future commercial loan
160 The PNC Financial Services Group, Inc. – Form 10-K