PNC Bank 2011 Annual Report Download - page 133
Download and view the complete annual report
Please find page 133 of the 2011 PNC Bank annual report below. You can navigate through the pages in the report by either clicking on the pages listed below, or by using the keyword search tool below to find specific information within the annual report.-
 1
1 -
2
-
3
-
4
-
5
-
6
-
7
-
8
-
9
-
10
-
11
-
12
-
13
-
14
-
15
-
16
-
17
-
18
-
19
-
20
-
21
-
22
-
23
-
24
-
25
-
26
-
27
-
28
-
29
-
30
-
31
-
32
-
33
-
34
-
35
-
36
-
37
-
38
-
39
-
40
-
41
-
42
-
43
-
44
-
45
-
46
-
47
-
48
-
49
-
50
-
51
-
52
-
53
-
54
-
55
-
56
-
57
-
58
-
59
-
60
-
61
-
62
-
63
-
64
-
65
-
66
-
67
-
68
-
69
-
70
-
71
-
72
-
73
-
74
-
75
-
76
-
77
-
78
-
79
-
80
-
81
-
82
-
83
-
84
-
85
-
86
-
87
-
88
-
89
-
90
-
91
-
92
-
93
-
94
-
95
-
96
-
97
-
98
-
99
-
100
-
101
-
102
-
103
-
104
-
105
-
106
-
107
-
108
-
109
-
110
-
111
-
112
-
113
-
114
-
115
-
116
-
117
-
118
-
119
-
120
-
121
-
122
-
 123
123 -
 124
124 -
 125
125 -
 126
126 -
 127
127 -
 128
128 -
 129
129 -
 130
130 -
 131
131 -
 132
132 -
 133
133 -
 134
134 -
 135
135 -
 136
136 -
 137
137 -
 138
138 -
 139
139 -
 140
140 -
 141
141 -
 142
142 -
 143
143 -
144
-
145
-
146
-
147
-
148
-
149
-
150
-
151
-
152
-
153
-
154
-
155
-
156
-
157
-
158
-
159
-
160
-
161
-
162
-
163
-
164
-
165
-
166
-
167
-
168
-
169
-
170
-
171
-
172
-
173
-
174
-
175
-
176
-
177
-
178
-
179
-
180
-
181
-
182
-
183
-
184
-
185
-
186
-
187
-
188
-
189
-
190
-
191
-
192
-
193
-
194
-
195
-
196
-
197
-
198
-
199
-
200
-
201
-
202
-
203
-
204
-
205
-
206
-
207
-
208
-
209
-
210
-
211
-
212
-
213
-
214
-
215
-
216
-
217
-
218
-
219
-
220
-
221
-
222
-
223
-
224
-
225
-
226
-
227
-
228
-
229
-
230
-
231
-
232
-
233
-
234
-
235
-
236
-
237
-
238
 |
 |
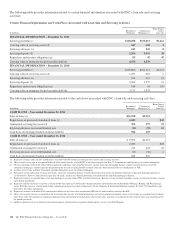
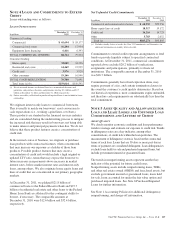
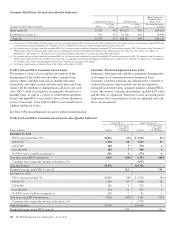
Assets and Liabilities of Consolidated VIEs (a)
In millions
Aggregate
Assets
Aggregate
Liabilities
December 31, 2011
Market Street $5,490 $5,491
Credit Card Securitization Trust 2,175 494
Tax Credit Investments (b) 2,503 723
December 31, 2010
Market Street $3,584 $3,588
Credit Card Securitization Trust 2,269 1,004
Tax Credit Investments (b) 1,590 420
(a) Amounts in this table differ from total assets and liabilities in the preceding “Consolidated VIEs – Carrying Value” table due to the elimination of intercompany assets and liabilities in
the preceding table.
(b) Amounts primarily represent LIHTC investments.
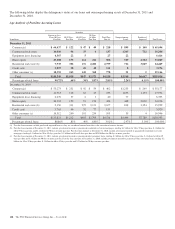
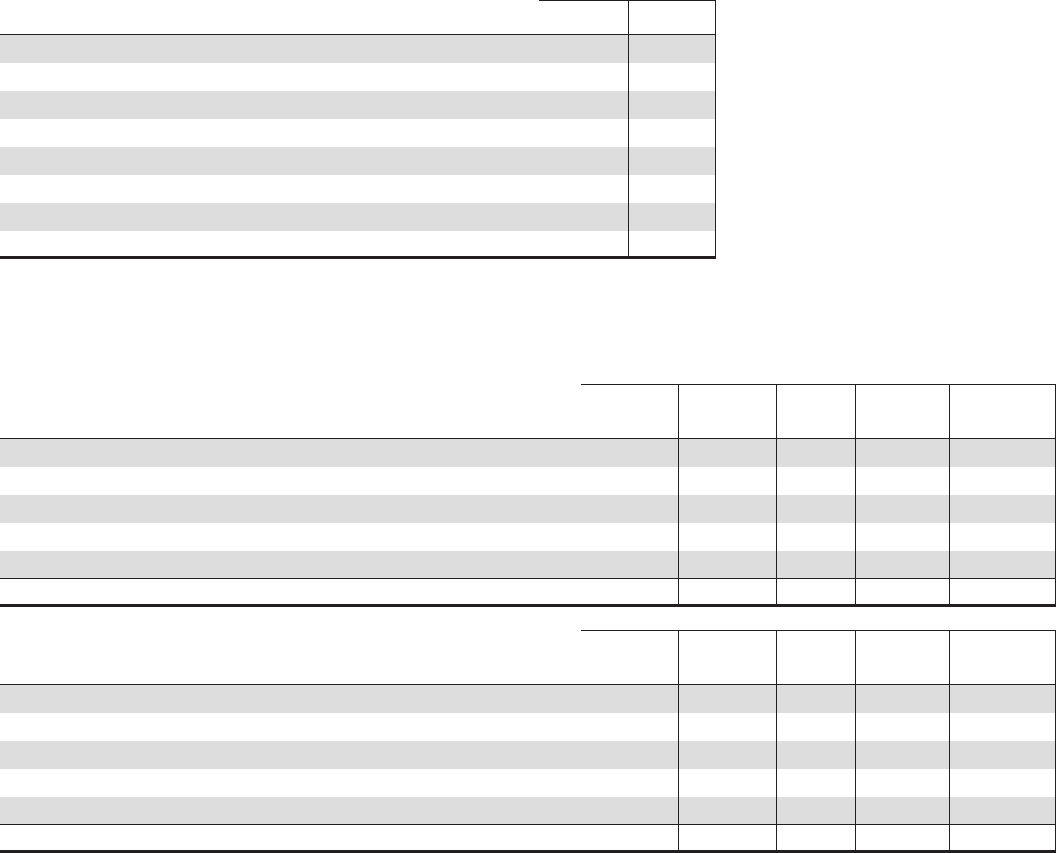
Non-Consolidated VIEs
In millions
Aggregate
Assets
Aggregate
Liabilities
PNC
Risk of
Loss
Carrying
Value of
Assets
Carrying
Value of
Liabilities
December 31, 2011
Tax Credit Investments (a) $ 5,382 $ 2,384 $ 836 $ 836(c) $352(d)
Commercial Mortgage-Backed Securitizations (b) 75,961 75,961 2,079 2,079(e)
Residential Mortgage-Backed Securitizations (b) 44,315 44,315 4,667 4,667(e) 99(d)
Collateralized Debt Obligations 13 1 1(c)
Total $125,671 $122,660 $7,583 $7,583 $451
In millions
Aggregate
Assets
Aggregate
Liabilities
PNC
Risk of
Loss
Carrying
Value of
Assets
Carrying
Value of
Liabilities
December 31, 2010
Tax Credit Investments (a) $ 4,086 $ 2,258 $ 782 $ 782(c) $301(d)
Commercial Mortgage-Backed Securitizations (b) 79,142 79,142 2,068 2,068(e)
Residential Mortgage-Backed Securitizations (b) 43,288 43,288 2,199 2,199(e) 7(d)
Collateralized Debt Obligations 18 1 1(c)
Total $126,534 $124,688 $5,050 $5,050 $308
(a) Amounts primarily represent LIHTC investments. Aggregate assets and aggregate liabilities represent estimated balances due to limited availability of financial information associated
with certain acquired partnerships.
(b) Amounts reflect involvement with securitization SPEs where PNC transferred to and/or services loans for a SPE and we hold securities issued by that SPE. Asset amounts equal
outstanding liability amounts of the SPEs due to limited availability of SPE financial information. We also invest in other mortgage and asset-backed securities issued by third-party
VIEs with which we have no continuing involvement. Further information on these securities is included in Note 7 Investment Securities and values disclosed represent our maximum
exposure to loss for those securities’ holdings.
(c) Included in Equity investments on our Consolidated Balance Sheet.
(d) Included in Other liabilities on our Consolidated Balance Sheet.
(e) Included in Trading securities, Investment securities, Other intangible assets, and Other assets on our Consolidated Balance Sheet.
124 The PNC Financial Services Group, Inc. – Form 10-K