PNC Bank 2011 Annual Report Download - page 112
Download and view the complete annual report
Please find page 112 of the 2011 PNC Bank annual report below. You can navigate through the pages in the report by either clicking on the pages listed below, or by using the keyword search tool below to find specific information within the annual report.-
 1
1 -
2
-
3
-
4
-
5
-
6
-
7
-
8
-
9
-
10
-
11
-
12
-
13
-
14
-
15
-
16
-
17
-
18
-
19
-
20
-
21
-
22
-
23
-
24
-
25
-
26
-
27
-
28
-
29
-
30
-
31
-
32
-
33
-
34
-
35
-
36
-
37
-
38
-
39
-
40
-
41
-
42
-
43
-
44
-
45
-
46
-
47
-
48
-
49
-
50
-
51
-
52
-
53
-
54
-
55
-
56
-
57
-
58
-
59
-
60
-
61
-
62
-
63
-
64
-
65
-
66
-
67
-
68
-
69
-
70
-
71
-
72
-
73
-
74
-
75
-
76
-
77
-
78
-
79
-
80
-
81
-
82
-
83
-
84
-
85
-
86
-
87
-
88
-
89
-
90
-
91
-
92
-
93
-
94
-
95
-
96
-
97
-
98
-
99
-
100
-
101
-
 102
102 -
 103
103 -
 104
104 -
 105
105 -
 106
106 -
 107
107 -
 108
108 -
 109
109 -
 110
110 -
 111
111 -
 112
112 -
 113
113 -
 114
114 -
 115
115 -
 116
116 -
 117
117 -
 118
118 -
 119
119 -
 120
120 -
 121
121 -
 122
122 -
123
-
124
-
125
-
126
-
127
-
128
-
129
-
130
-
131
-
132
-
133
-
134
-
135
-
136
-
137
-
138
-
139
-
140
-
141
-
142
-
143
-
144
-
145
-
146
-
147
-
148
-
149
-
150
-
151
-
152
-
153
-
154
-
155
-
156
-
157
-
158
-
159
-
160
-
161
-
162
-
163
-
164
-
165
-
166
-
167
-
168
-
169
-
170
-
171
-
172
-
173
-
174
-
175
-
176
-
177
-
178
-
179
-
180
-
181
-
182
-
183
-
184
-
185
-
186
-
187
-
188
-
189
-
190
-
191
-
192
-
193
-
194
-
195
-
196
-
197
-
198
-
199
-
200
-
201
-
202
-
203
-
204
-
205
-
206
-
207
-
208
-
209
-
210
-
211
-
212
-
213
-
214
-
215
-
216
-
217
-
218
-
219
-
220
-
221
-
222
-
223
-
224
-
225
-
226
-
227
-
228
-
229
-
230
-
231
-
232
-
233
-
234
-
235
-
236
-
237
-
238
 |
 |

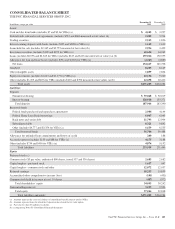
CONSOLIDATED BALANCE SHEET
THE PNC FINANCIAL SERVICES GROUP, INC.
In millions, except par value
December 31
2011
December 31
2010
Assets
Cash and due from banks (includes $7 and $2 for VIEs) (a) $ 4,105 $ 3,297
Federal funds sold and resale agreements (includes $732 and $866 measured at fair value) (b) 2,205 3,704
Trading securities 2,513 1,826
Interest-earning deposits with banks (includes $325 and $288 for VIEs) (a) 1,169 1,610
Loans held for sale (includes $2,365 and $2,755 measured at fair value) (b) 2,936 3,492
Investment securities (includes $109 and $192 for VIEs) (a) 60,634 64,262
Loans (includes $6,096 and $4,645 for VIEs) (includes $227 and $116 measured at fair value) (a) (b) 159,014 150,595
Allowance for loan and lease losses (includes $(91) and $(183) for VIEs) (a) (4,347) (4,887)
Net loans 154,667 145,708
Goodwill 8,285 8,149
Other intangible assets 1,859 2,604
Equity investments (includes $1,643 and $1,177 for VIEs) (a) 10,134 9,220
Other (includes $1,205 and $676 for VIEs) (includes $210 and $396 measured at fair value) (a) (b) 22,698 20,412
Total assets $271,205 $264,284
Liabilities
Deposits
Noninterest-bearing $ 59,048 $ 50,019
Interest-bearing 128,918 133,371
Total deposits 187,966 183,390
Borrowed funds
Federal funds purchased and repurchase agreements 2,984 4,144
Federal Home Loan Bank borrowings 6,967 6,043
Bank notes and senior debt 11,793 12,904
Subordinated debt 8,321 9,842
Other (includes $4,777 and $3,354 for VIEs) (a) 6,639 6,555
Total borrowed funds 36,704 39,488
Allowance for unfunded loan commitments and letters of credit 240 188
Accrued expenses (includes $155 and $88 for VIEs) (a) 4,175 3,188
Other (includes $734 and $456 for VIEs) (a) 4,874 5,192
Total liabilities 233,959 231,446
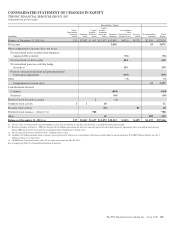
Equity
Preferred stock (c)
Common stock ($5 par value, authorized 800 shares, issued 537 and 536 shares) 2,683 2,682
Capital surplus – preferred stock 1,637 647
Capital surplus – common stock and other 12,072 12,057
Retained earnings 18,253 15,859
Accumulated other comprehensive income (loss) (105) (431)
Common stock held in treasury at cost: 10 shares (487) (572)
Total shareholders’ equity 34,053 30,242
Noncontrolling interests 3,193 2,596
Total equity 37,246 32,838
Total liabilities and equity $271,205 $264,284
(a) Amounts represent the assets or liabilities of consolidated variable interest entities (VIEs).
(b) Amounts represent items for which the Corporation has elected the fair value option.
(c) Par value less than $.5 million at each date.
See accompanying Notes To Consolidated Financial Statements.
The PNC Financial Services Group, Inc. – Form 10-K 103