PNC Bank 2011 Annual Report Download - page 58
Download and view the complete annual report
Please find page 58 of the 2011 PNC Bank annual report below. You can navigate through the pages in the report by either clicking on the pages listed below, or by using the keyword search tool below to find specific information within the annual report.-
 1
1 -
2
-
3
-
4
-
5
-
6
-
7
-
8
-
9
-
10
-
11
-
12
-
13
-
14
-
15
-
16
-
17
-
18
-
19
-
20
-
21
-
22
-
23
-
24
-
25
-
26
-
27
-
28
-
29
-
30
-
31
-
32
-
33
-
34
-
35
-
36
-
37
-
38
-
39
-
40
-
41
-
42
-
43
-
44
-
45
-
46
-
47
-
 48
48 -
 49
49 -
 50
50 -
 51
51 -
 52
52 -
 53
53 -
 54
54 -
 55
55 -
 56
56 -
 57
57 -
 58
58 -
 59
59 -
 60
60 -
 61
61 -
 62
62 -
 63
63 -
 64
64 -
 65
65 -
 66
66 -
 67
67 -
 68
68 -
69
-
70
-
71
-
72
-
73
-
74
-
75
-
76
-
77
-
78
-
79
-
80
-
81
-
82
-
83
-
84
-
85
-
86
-
87
-
88
-
89
-
90
-
91
-
92
-
93
-
94
-
95
-
96
-
97
-
98
-
99
-
100
-
101
-
102
-
103
-
104
-
105
-
106
-
107
-
108
-
109
-
110
-
111
-
112
-
113
-
114
-
115
-
116
-
117
-
118
-
119
-
120
-
121
-
122
-
123
-
124
-
125
-
126
-
127
-
128
-
129
-
130
-
131
-
132
-
133
-
134
-
135
-
136
-
137
-
138
-
139
-
140
-
141
-
142
-
143
-
144
-
145
-
146
-
147
-
148
-
149
-
150
-
151
-
152
-
153
-
154
-
155
-
156
-
157
-
158
-
159
-
160
-
161
-
162
-
163
-
164
-
165
-
166
-
167
-
168
-
169
-
170
-
171
-
172
-
173
-
174
-
175
-
176
-
177
-
178
-
179
-
180
-
181
-
182
-
183
-
184
-
185
-
186
-
187
-
188
-
189
-
190
-
191
-
192
-
193
-
194
-
195
-
196
-
197
-
198
-
199
-
200
-
201
-
202
-
203
-
204
-
205
-
206
-
207
-
208
-
209
-
210
-
211
-
212
-
213
-
214
-
215
-
216
-
217
-
218
-
219
-
220
-
221
-
222
-
223
-
224
-
225
-
226
-
227
-
228
-
229
-
230
-
231
-
232
-
233
-
234
-
235
-
236
-
237
-
238
 |
 |
F
AIR
V
ALUE
M
EASUREMENTS
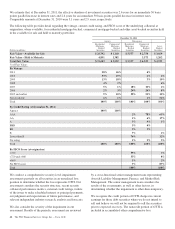
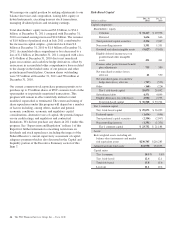
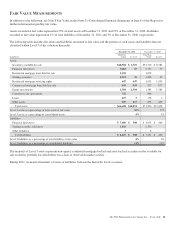
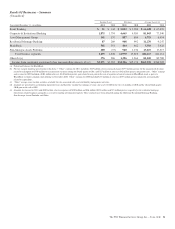
In addition to the following, see Note 8 Fair Value in the Notes To Consolidated Financial Statements in Item 8 of this Report for
further information regarding fair value.
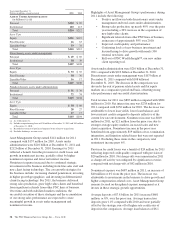
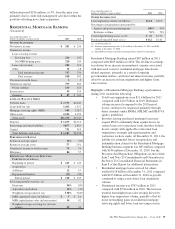
Assets recorded at fair value represented 25% of total assets at December 31, 2011 and 27% at December 31, 2010. Liabilities
recorded at fair value represented 4% of total liabilities at December 31, 2011 and 3% at December 31, 2010, respectively.
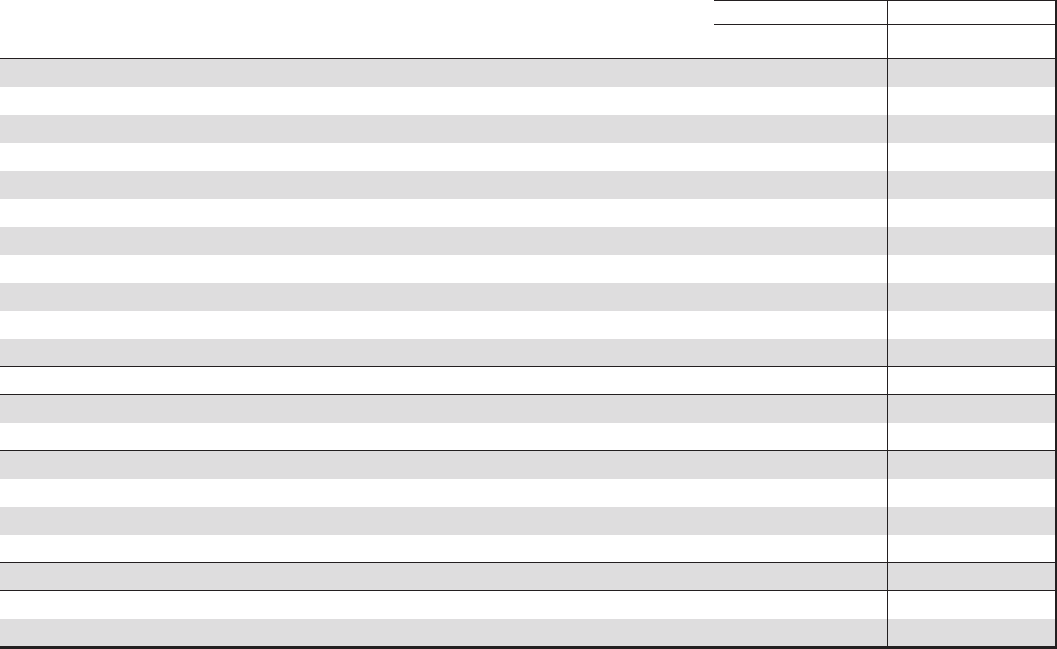
The following table includes the assets and liabilities measured at fair value and the portion of such assets and liabilities that are
classified within Level 3 of the valuation hierarchy.
December 31, 2011 December 31, 2010
In millions
Total Fair
Value Level 3
Total Fair
Value Level 3
Assets
Securities available for sale $48,568 $ 6,729 $57,310 $ 8,583
Financial derivatives 9,463 67 5,757 77
Residential mortgage loans held for sale 1,522 1,878
Trading securities 2,513 39 1,826 69
Residential mortgage servicing rights 647 647 1,033 1,033
Commercial mortgage loans held for sale 843 843 877 877
Equity investments 1,504 1,504 1,384 1,384
Customer resale agreements 732 866
Loans 227 5 116 2
Other assets 639 217 853 403
Total assets $66,658 $10,051 $71,900 $12,428
Level 3 assets as a percentage of total assets at fair value 15% 17%
Level 3 assets as a percentage of consolidated assets 4% 5%
Liabilities
Financial derivatives $ 7,606 $ 308 $ 4,935 $ 460
Trading securities sold short 1,016 2,530
Other liabilities 36
Total liabilities $ 8,625 $ 308 $ 7,471 $ 460
Level 3 liabilities as a percentage of total liabilities at fair value 4% 6%
Level 3 liabilities as a percentage of consolidated liabilities <1% <1%
The majority of Level 3 assets represent non-agency residential mortgage-backed and asset-backed securities in the available for
sale securities portfolio for which there was a lack of observable market activity.
During 2011, no material transfers of assets or liabilities between the hierarchy levels occurred.
The PNC Financial Services Group, Inc. – Form 10-K 49