PNC Bank 2011 Annual Report Download - page 140
Download and view the complete annual report
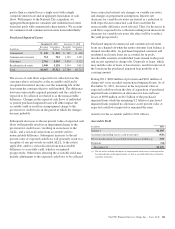
Please find page 140 of the 2011 PNC Bank annual report below. You can navigate through the pages in the report by either clicking on the pages listed below, or by using the keyword search tool below to find specific information within the annual report.-
 1
1 -
2
-
3
-
4
-
5
-
6
-
7
-
8
-
9
-
10
-
11
-
12
-
13
-
14
-
15
-
16
-
17
-
18
-
19
-
20
-
21
-
22
-
23
-
24
-
25
-
26
-
27
-
28
-
29
-
30
-
31
-
32
-
33
-
34
-
35
-
36
-
37
-
38
-
39
-
40
-
41
-
42
-
43
-
44
-
45
-
46
-
47
-
48
-
49
-
50
-
51
-
52
-
53
-
54
-
55
-
56
-
57
-
58
-
59
-
60
-
61
-
62
-
63
-
64
-
65
-
66
-
67
-
68
-
69
-
70
-
71
-
72
-
73
-
74
-
75
-
76
-
77
-
78
-
79
-
80
-
81
-
82
-
83
-
84
-
85
-
86
-
87
-
88
-
89
-
90
-
91
-
92
-
93
-
94
-
95
-
96
-
97
-
98
-
99
-
100
-
101
-
102
-
103
-
104
-
105
-
106
-
107
-
108
-
109
-
110
-
111
-
112
-
113
-
114
-
115
-
116
-
117
-
118
-
119
-
120
-
121
-
122
-
123
-
124
-
125
-
126
-
127
-
128
-
129
-
 130
130 -
 131
131 -
 132
132 -
 133
133 -
 134
134 -
 135
135 -
 136
136 -
 137
137 -
 138
138 -
 139
139 -
 140
140 -
 141
141 -
 142
142 -
 143
143 -
 144
144 -
 145
145 -
 146
146 -
 147
147 -
 148
148 -
 149
149 -
 150
150 -
151
-
152
-
153
-
154
-
155
-
156
-
157
-
158
-
159
-
160
-
161
-
162
-
163
-
164
-
165
-
166
-
167
-
168
-
169
-
170
-
171
-
172
-
173
-
174
-
175
-
176
-
177
-
178
-
179
-
180
-
181
-
182
-
183
-
184
-
185
-
186
-
187
-
188
-
189
-
190
-
191
-
192
-
193
-
194
-
195
-
196
-
197
-
198
-
199
-
200
-
201
-
202
-
203
-
204
-
205
-
206
-
207
-
208
-
209
-
210
-
211
-
212
-
213
-
214
-
215
-
216
-
217
-
218
-
219
-
220
-
221
-
222
-
223
-
224
-
225
-
226
-
227
-
228
-
229
-
230
-
231
-
232
-
233
-
234
-
235
-
236
-
237
-
238
 |
 |
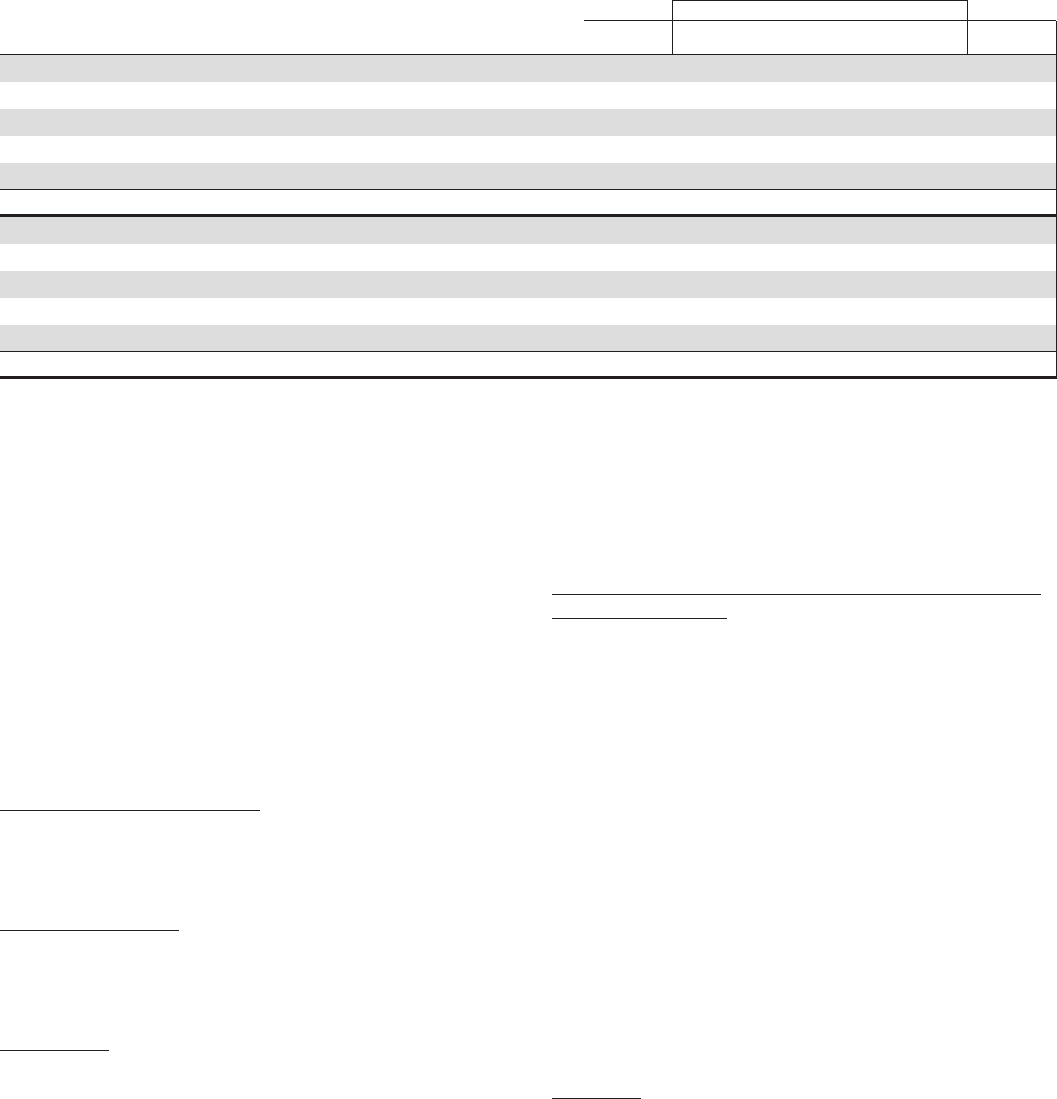
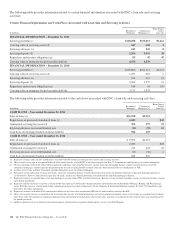
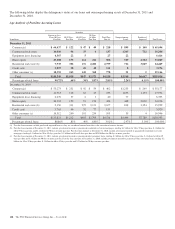
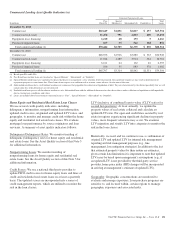
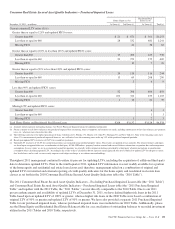
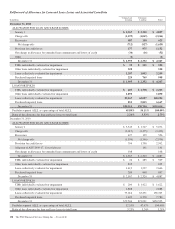
Commercial Lending Asset Quality Indicators (a)
Criticized Commercial Loans
In millions
Pass
Rated (b)
Special
Mention (c) Substandard (d) Doubtful (e)
Total
Loans
December 31, 2011
Commercial $60,649 $1,831 $2,817 $ 257 $65,554
Commercial real estate 11,478 791 2,823 400 15,492
Equipment lease financing 6,210 48 153 5 6,416
Purchased impaired loans 107 35 542 168 852
Total commercial lending (f) $78,444 $2,705 $6,335 $ 830 $88,314
December 31, 2010
Commercial $48,556 $1,926 $3,883 $ 563 $54,928
Commercial real estate 11,014 1,289 3,914 564 16,781
Equipment lease financing 6,121 64 162 46 6,393
Purchased impaired loans 106 35 883 378 1,402
Total commercial lending (f) $65,797 $3,314 $8,842 $1,551 $79,504
(a) Based upon PDs and LGDs.
(b) Pass Rated loans include loans not classified as “Special Mention”, “Substandard”, or “Doubtful”.
(c) Special Mention rated loans have a potential weakness that deserves management’s close attention. If left uncorrected, these potential weaknesses may result in deterioration of
repayment prospects at some future date. These loans do not expose us to sufficient risk to warrant a more adverse classification at this time.
(d) Substandard rated loans have a well-defined weakness or weaknesses that jeopardize the collection or liquidation of debt. They are characterized by the distinct possibility that we will
sustain some loss if the deficiencies are not corrected.
(e) Doubtful rated loans possess all the inherent weaknesses of a Substandard loan with the additional characteristics that the weakness makes collection or liquidation in full improbable
due to existing facts, conditions, and values.
(f) Loans are included above based on their contractual terms as “Pass”, “Special Mention”, “Substandard” or “Doubtful”.
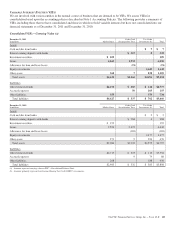
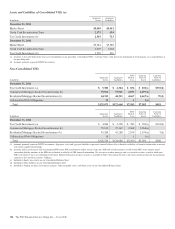
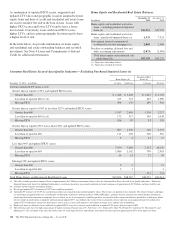
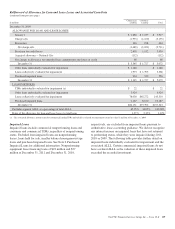
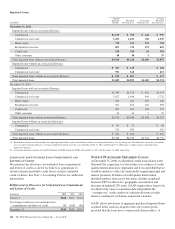
Home Equity and Residential Real Estate Loan Classes
We use several credit quality indicators, including
delinquency information, nonperforming loan information,
updated credit scores, originated and updated LTV ratios, and
geography, to monitor and manage credit risk within the home
equity and residential real estate loan classes. We evaluate
mortgage loan performance by source originators and loan
servicers. A summary of asset quality indicators follows:
Delinquency/Delinquency Rates: We monitor trending of
delinquency/delinquency rates for home equity and residential
real estate loans. See the Asset Quality section of this Note 5
for additional information.
Nonperforming Loans: We monitor trending of
nonperforming loans for home equity and residential real
estate loans. See the Asset Quality section of this Note 5 for
additional information.
Credit Scores: We use a national third-party provider to
update FICO credit scores for home equity loans and lines of
credit and residential real estate loans on at least a quarterly
basis. The updated scores are incorporated into a series of
credit management reports, which are utilized to monitor the
risk in the loan classes.
LTV (inclusive of combined loan-to-value (CLTV) ratios for
second lien positions): At least annually, we update the
property values of real estate collateral and calculate an
updated LTV ratio. For open-end credit lines secured by real
estate in regions experiencing significant declines in property
values, more frequent valuations may occur. We examine
LTV migration and stratify LTV into categories to monitor the
risk in the loan classes.
Historically, we used, and we continue to use, a combination of
original LTV and updated LTV for internal risk management
reporting and risk management purposes (e.g., line
management, loss mitigation strategies). In addition to the fact
that estimated property values by their nature are estimates,
given certain data limitations it is important to note that updated
LTVs may be based upon management’s assumptions (e.g., if
an updated LTV is not provided by the third-party service
provider, home price index (HPI) changes will be incorporated
in arriving at management’s estimate of updated LTV).
Geography: Geographic concentrations are monitored to
evaluate and manage exposures. Loan purchase programs are
sensitive to, and focused within, certain regions to manage
geographic exposures and associated risks.
The PNC Financial Services Group, Inc. – Form 10-K 131