PNC Bank 2011 Annual Report Download - page 45
Download and view the complete annual report
Please find page 45 of the 2011 PNC Bank annual report below. You can navigate through the pages in the report by either clicking on the pages listed below, or by using the keyword search tool below to find specific information within the annual report.-
 1
1 -
2
-
3
-
4
-
5
-
6
-
7
-
8
-
9
-
10
-
11
-
12
-
13
-
14
-
15
-
16
-
17
-
18
-
19
-
20
-
21
-
22
-
23
-
24
-
25
-
26
-
27
-
28
-
29
-
30
-
31
-
32
-
33
-
34
-
 35
35 -
 36
36 -
 37
37 -
 38
38 -
 39
39 -
 40
40 -
 41
41 -
 42
42 -
 43
43 -
 44
44 -
 45
45 -
 46
46 -
 47
47 -
 48
48 -
 49
49 -
 50
50 -
 51
51 -
 52
52 -
 53
53 -
 54
54 -
 55
55 -
56
-
57
-
58
-
59
-
60
-
61
-
62
-
63
-
64
-
65
-
66
-
67
-
68
-
69
-
70
-
71
-
72
-
73
-
74
-
75
-
76
-
77
-
78
-
79
-
80
-
81
-
82
-
83
-
84
-
85
-
86
-
87
-
88
-
89
-
90
-
91
-
92
-
93
-
94
-
95
-
96
-
97
-
98
-
99
-
100
-
101
-
102
-
103
-
104
-
105
-
106
-
107
-
108
-
109
-
110
-
111
-
112
-
113
-
114
-
115
-
116
-
117
-
118
-
119
-
120
-
121
-
122
-
123
-
124
-
125
-
126
-
127
-
128
-
129
-
130
-
131
-
132
-
133
-
134
-
135
-
136
-
137
-
138
-
139
-
140
-
141
-
142
-
143
-
144
-
145
-
146
-
147
-
148
-
149
-
150
-
151
-
152
-
153
-
154
-
155
-
156
-
157
-
158
-
159
-
160
-
161
-
162
-
163
-
164
-
165
-
166
-
167
-
168
-
169
-
170
-
171
-
172
-
173
-
174
-
175
-
176
-
177
-
178
-
179
-
180
-
181
-
182
-
183
-
184
-
185
-
186
-
187
-
188
-
189
-
190
-
191
-
192
-
193
-
194
-
195
-
196
-
197
-
198
-
199
-
200
-
201
-
202
-
203
-
204
-
205
-
206
-
207
-
208
-
209
-
210
-
211
-
212
-
213
-
214
-
215
-
216
-
217
-
218
-
219
-
220
-
221
-
222
-
223
-
224
-
225
-
226
-
227
-
228
-
229
-
230
-
231
-
232
-
233
-
234
-
235
-
236
-
237
-
238
 |
 |
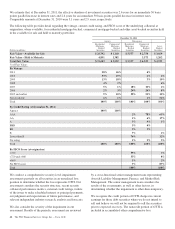
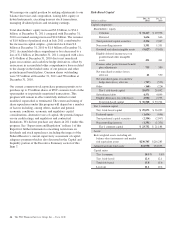
The net interest margin was 3.92% for 2011 and 4.14% for
2010. The following factors impacted the comparison:
• A 41 basis point decrease in the yield on interest-
earning assets. The yield on loans, the largest portion
of our earning assets, decreased 38 basis points.
• These factors were partially offset by a 20 basis point
decline in the rate accrued on interest-bearing
liabilities. The rate accrued on interest-bearing
deposits, the largest component, decreased 19 basis
points primarily in retail certificates of deposit.
We expect our 2012 net interest income, including the results
of our pending RBC Bank (USA) acquisition following
closing, to increase in percentage terms by mid-to-high single
digits compared to 2011 as core net interest income should
continue to grow offset by the expected decline in purchase
accounting accretion, assuming the economic outlook for
2012 will be a continuation of the 2011 environment.
N
ONINTEREST
I
NCOME
Noninterest income totaled $5.6 billion for 2011 and $5.9
billion for 2010. Noninterest income for 2011 reflected higher
asset management fees and other income, higher residential
mortgage banking revenue, and lower net other-than-
temporary impairments (OTTI), that were offset by a decrease
in corporate service fees primarily due to a reduction in the
value of commercial mortgage servicing rights, lower service
charges on deposits from the impact of Regulation E rules
pertaining to overdraft fees, a decrease in net gains on sales of
securities and lower consumer services fees due, in part, to a
decline in interchange fees on individual debit card
transactions in the fourth quarter partially offset by higher
transaction volumes throughout 2011.
Asset management revenue, including BlackRock, increased
$34 million to $1.1 billion in 2011 compared with 2010. The
increase was driven by strong sales performance by our Asset
Management Group and somewhat higher equity earnings
from our BlackRock investment. Discretionary assets under
management at December 31, 2011 totaled $107 billion
compared with $108 billion at December 31, 2010.
For 2011, consumer services fees totaled $1.2 billion
compared with $1.3 billion in 2010. The decrease was due to
lower interchange rates on debit card transactions, lower
brokerage related revenue, and lower ATM related fees,
partially offset by higher volumes of customer-initiated
transactions including debit and credit cards. As further
discussed in the Retail Banking section of the Business
Segments Review portion of this Item 7, the Dodd-Frank
limits on interchange rates were effective October 1, 2011 and
had a negative impact on revenues of approximately $75
million in the fourth quarter of 2011, and are expected to have
an additional incremental reduction on 2012 annual revenue of
approximately $175 million, based on 2011 transaction
volumes.
Corporate services revenue totaled $.9 billion in 2011 and
$1.1 billion in 2010. Lower values of commercial mortgage
servicing rights, largely driven by lower interest rates and
higher loan prepayment rates, and lower special servicing fees
drove the decline.
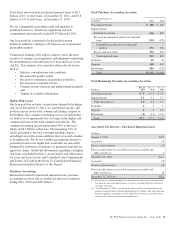
Residential mortgage revenue totaled $713 million in 2011
and $699 million in 2010. Higher loans sales revenue drove
the comparison, largely offset by lower net hedging gains on
mortgage servicing rights and lower servicing fees.
Service charges on deposits totaled $534 million for 2011 and
$705 million for 2010. The decline resulted primarily from the
impact of Regulation E rules pertaining to overdraft fees. As
further discussed in the Retail Banking section of the Business
Segments Review portion of this Item 7, the new Regulation E
rules related to overdraft charges negatively impacted our
2011 revenue by approximately $200 million compared with
2010.
Net gains on sales of securities totaled $249 million for 2011
and $426 million for 2010. The net credit component of OTTI
of securities recognized in earnings was a loss of $152 million
in 2011, compared with a loss of $325 million in 2010.
Gains on BlackRock related transactions included a fourth
quarter 2010 pretax gain of $160 million from our sale of
7.5 million BlackRock common shares as part of a BlackRock
secondary common stock offering.
Other noninterest income totaled $1.1 billion for 2011
compared with $.9 billion for 2010.
The diversity of our revenue streams should enable us to
achieve a solid performance in an environment that will
continue to be affected by regulatory reform headwinds and
implementation challenges. Looking to 2012, we see
opportunities for growth as a result of our larger franchise and
the pending acquisition, our ability to cross-sell our products
and services to existing clients and our progress in adding new
clients. We expect noninterest income to increase in
percentage terms by the mid-single digits despite further
regulatory impacts on debit card interchange fees, assuming
the economic outlook for 2012 will be a continuation of the
2011 environment.
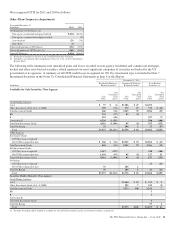
P
RODUCT
R
EVENUE
In addition to credit and deposit products for commercial
customers, Corporate & Institutional Banking offers other
services, including treasury management, capital markets-
related products and services, and commercial mortgage
banking activities for customers in all business segments. A
portion of the revenue and expense related to these products is
reflected in Corporate & Institutional Banking and the
remainder is reflected in the results of other businesses. The
Other Information section in the Corporate & Institutional
Banking table in the Business Segments Review section of
36 The PNC Financial Services Group, Inc. – Form 10-K