PNC Bank 2011 Annual Report Download - page 75
Download and view the complete annual report
Please find page 75 of the 2011 PNC Bank annual report below. You can navigate through the pages in the report by either clicking on the pages listed below, or by using the keyword search tool below to find specific information within the annual report.-
 1
1 -
2
-
3
-
4
-
5
-
6
-
7
-
8
-
9
-
10
-
11
-
12
-
13
-
14
-
15
-
16
-
17
-
18
-
19
-
20
-
21
-
22
-
23
-
24
-
25
-
26
-
27
-
28
-
29
-
30
-
31
-
32
-
33
-
34
-
35
-
36
-
37
-
38
-
39
-
40
-
41
-
42
-
43
-
44
-
45
-
46
-
47
-
48
-
49
-
50
-
51
-
52
-
53
-
54
-
55
-
56
-
57
-
58
-
59
-
60
-
61
-
62
-
63
-
64
-
 65
65 -
 66
66 -
 67
67 -
 68
68 -
 69
69 -
 70
70 -
 71
71 -
 72
72 -
 73
73 -
 74
74 -
 75
75 -
 76
76 -
 77
77 -
 78
78 -
 79
79 -
 80
80 -
 81
81 -
 82
82 -
 83
83 -
 84
84 -
 85
85 -
86
-
87
-
88
-
89
-
90
-
91
-
92
-
93
-
94
-
95
-
96
-
97
-
98
-
99
-
100
-
101
-
102
-
103
-
104
-
105
-
106
-
107
-
108
-
109
-
110
-
111
-
112
-
113
-
114
-
115
-
116
-
117
-
118
-
119
-
120
-
121
-
122
-
123
-
124
-
125
-
126
-
127
-
128
-
129
-
130
-
131
-
132
-
133
-
134
-
135
-
136
-
137
-
138
-
139
-
140
-
141
-
142
-
143
-
144
-
145
-
146
-
147
-
148
-
149
-
150
-
151
-
152
-
153
-
154
-
155
-
156
-
157
-
158
-
159
-
160
-
161
-
162
-
163
-
164
-
165
-
166
-
167
-
168
-
169
-
170
-
171
-
172
-
173
-
174
-
175
-
176
-
177
-
178
-
179
-
180
-
181
-
182
-
183
-
184
-
185
-
186
-
187
-
188
-
189
-
190
-
191
-
192
-
193
-
194
-
195
-
196
-
197
-
198
-
199
-
200
-
201
-
202
-
203
-
204
-
205
-
206
-
207
-
208
-
209
-
210
-
211
-
212
-
213
-
214
-
215
-
216
-
217
-
218
-
219
-
220
-
221
-
222
-
223
-
224
-
225
-
226
-
227
-
228
-
229
-
230
-
231
-
232
-
233
-
234
-
235
-
236
-
237
-
238
 |
 |

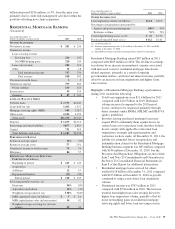
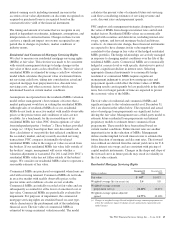
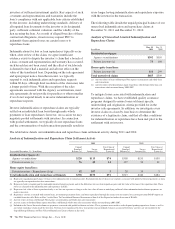
Commercial Mortgage Servicing Rights
Dollars in millions
December 31
2011
December 31
2010
Fair value $ 471 $ 674
Weighted-average life (in years) (a) 5.9 6.3
Prepayment rate range (a) (b) 13% – 28% 10% – 24%
Effective discount rate range 6%–9% 7% – 9%
(a) Changes in weighted-average life and prepayment rate reflect the cumulative impact
of changes in rates, prepayment expectations and model changes.
(b) Represents modeled prepayment rates considering the effective dates of prepayment
penalties.
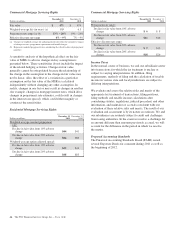
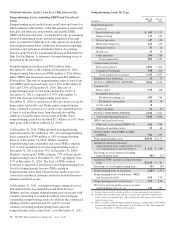
A sensitivity analysis of the hypothetical effect on the fair
value of MSRs to adverse changes in key assumptions is
presented below. These sensitivities do not include the impact
of the related hedging activities. Changes in fair value
generally cannot be extrapolated because the relationship of
the change in the assumption to the change in fair value may
not be linear. Also, the effect of a variation in a particular
assumption on the fair value of the MSRs is calculated
independently without changing any other assumption. In
reality, changes in one factor may result in changes in another
(for example, changes in mortgage interest rates, which drive
changes in prepayment rate estimates, could result in changes
in the interest rate spread), which could either magnify or
counteract the sensitivities.
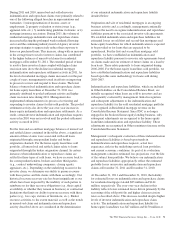
Residential Mortgage Servicing Rights
Dollars in millions
December 31
2011
December 31
2010
Weighted-average constant prepayment
rate:
Decline in fair value from 10% adverse
change $44 $41
Decline in fair value from 20% adverse
change $84 $86
Weighted-average option adjusted spread:
Decline in fair value from 10% adverse
change $25 $43
Decline in fair value from 20% adverse
change $48 $83
Commercial Mortgage Servicing Rights
Dollars in millions
December 31
2011
December 31
2010
Prepayment rate range:
Decline in fair value from 10% adverse
change $6 $8
Decline in fair value from 20% adverse
change $11 $16
Effective discount rate range:
Decline in fair value from 10% adverse
change $9 $13
Decline in fair value from 20% adverse
change $18 $26
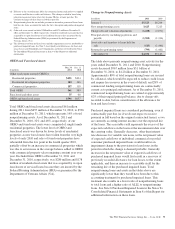
Income Taxes
In the normal course of business, we and our subsidiaries enter
into transactions for which the tax treatment is unclear or
subject to varying interpretations. In addition, filing
requirements, methods of filing and the calculation of taxable
income in various state and local jurisdictions are subject to
differing interpretations.
We evaluate and assess the relative risks and merits of the
appropriate tax treatment of transactions, filing positions,
filing methods and taxable income calculations after
considering statutes, regulations, judicial precedent, and other
information, and maintain tax accruals consistent with our
evaluation of these relative risks and merits. The result of our
evaluation and assessment is by its nature an estimate. We and
our subsidiaries are routinely subject to audit and challenges
from taxing authorities. In the event we resolve a challenge for
an amount different than amounts previously accrued, we will
account for the difference in the period in which we resolve
the matter.
Proposed Accounting Standards
The Financial Accounting Standards Board (FASB) issued
several Exposure Drafts for comment during 2011 as well as
the beginning of 2012.
66 The PNC Financial Services Group, Inc. – Form 10-K