PNC Bank 2011 Annual Report Download - page 74
Download and view the complete annual report
Please find page 74 of the 2011 PNC Bank annual report below. You can navigate through the pages in the report by either clicking on the pages listed below, or by using the keyword search tool below to find specific information within the annual report.-
 1
1 -
2
-
3
-
4
-
5
-
6
-
7
-
8
-
9
-
10
-
11
-
12
-
13
-
14
-
15
-
16
-
17
-
18
-
19
-
20
-
21
-
22
-
23
-
24
-
25
-
26
-
27
-
28
-
29
-
30
-
31
-
32
-
33
-
34
-
35
-
36
-
37
-
38
-
39
-
40
-
41
-
42
-
43
-
44
-
45
-
46
-
47
-
48
-
49
-
50
-
51
-
52
-
53
-
54
-
55
-
56
-
57
-
58
-
59
-
60
-
61
-
62
-
63
-
 64
64 -
 65
65 -
 66
66 -
 67
67 -
 68
68 -
 69
69 -
 70
70 -
 71
71 -
 72
72 -
 73
73 -
 74
74 -
 75
75 -
 76
76 -
 77
77 -
 78
78 -
 79
79 -
 80
80 -
 81
81 -
 82
82 -
 83
83 -
 84
84 -
85
-
86
-
87
-
88
-
89
-
90
-
91
-
92
-
93
-
94
-
95
-
96
-
97
-
98
-
99
-
100
-
101
-
102
-
103
-
104
-
105
-
106
-
107
-
108
-
109
-
110
-
111
-
112
-
113
-
114
-
115
-
116
-
117
-
118
-
119
-
120
-
121
-
122
-
123
-
124
-
125
-
126
-
127
-
128
-
129
-
130
-
131
-
132
-
133
-
134
-
135
-
136
-
137
-
138
-
139
-
140
-
141
-
142
-
143
-
144
-
145
-
146
-
147
-
148
-
149
-
150
-
151
-
152
-
153
-
154
-
155
-
156
-
157
-
158
-
159
-
160
-
161
-
162
-
163
-
164
-
165
-
166
-
167
-
168
-
169
-
170
-
171
-
172
-
173
-
174
-
175
-
176
-
177
-
178
-
179
-
180
-
181
-
182
-
183
-
184
-
185
-
186
-
187
-
188
-
189
-
190
-
191
-
192
-
193
-
194
-
195
-
196
-
197
-
198
-
199
-
200
-
201
-
202
-
203
-
204
-
205
-
206
-
207
-
208
-
209
-
210
-
211
-
212
-
213
-
214
-
215
-
216
-
217
-
218
-
219
-
220
-
221
-
222
-
223
-
224
-
225
-
226
-
227
-
228
-
229
-
230
-
231
-
232
-
233
-
234
-
235
-
236
-
237
-
238
 |
 |

interest-earning assets including unearned income in the
accretion of fair value adjustments on discounts recognized on
acquired or purchased loans is recognized based on the
constant effective yield of the financial instrument.
The timing and amount of revenue that we recognize in any
period is dependent on estimates, judgments, assumptions, and
interpretation of contractual terms. Changes in these factors
can have a significant impact on revenue recognized in any
period due to changes in products, market conditions or
industry norms.
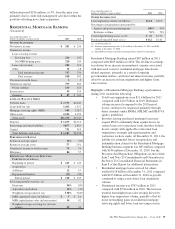
Residential And Commercial Mortgage Servicing Rights
We elect to measure our residential mortgage servicing rights
(MSRs) at fair value. This election was made to be consistent
with our risk management strategy to hedge changes in the
fair value of these assets as described below. The fair value of
residential MSRs is estimated by using a cash flow valuation
model which calculates the present value of estimated future
net servicing cash flows, taking into consideration actual and
expected mortgage loan prepayment rates, discount rates,
servicing costs, and other economic factors which are
determined based on current market conditions.
Assumptions incorporated into the residential MSRs valuation
model reflect management’s best estimate of factors that a
market participant would use in valuing the residential MSRs.
Although sales of residential MSRs do occur, residential
MSRs do not trade in an active market with readily observable
prices so the precise terms and conditions of sales are not
available. As a benchmark for the reasonableness of its
residential MSRs fair value, PNC obtains opinions of value
from independent parties (“brokers”). These brokers provided
a range (+/- 10 bps) based upon their own discounted cash
flow calculations of our portfolio that reflected conditions in
the secondary market, and any recently executed servicing
transactions. PNC compares its internally-developed
residential MSRs value to the ranges of values received from
the brokers. If our residential MSRs fair value falls outside of
the brokers’ ranges, management will assess whether a
valuation adjustment is warranted. For 2011 and 2010, PNC’s
residential MSRs value has not fallen outside of the brokers’
ranges. We consider our residential MSRs value to represent a
reasonable estimate of fair value.
Commercial MSRs are purchased or originated when loans are
sold with servicing retained. Commercial MSRs do not trade
in an active market with readily observable prices so the
precise terms and conditions of sales are not available.
Commercial MSRs are initially recorded at fair value and are
subsequently accounted for at the lower of amortized cost or
fair value. Commercial MSRs are periodically evaluated for
impairment. For purposes of impairment, the commercial
mortgage servicing rights are stratified based on asset type,
which characterizes the predominant risk of the underlying
financial asset. The fair value of commercial MSRs is
estimated by using an internal valuation model. The model
calculates the present value of estimated future net servicing
cash flows considering estimates of servicing revenue and
costs, discount rates and prepayment speeds.
PNC employs risk management strategies designed to protect
the value of MSRs from changes in interest rates and related
market factors. Residential MSRs values are economically
hedged with securities and derivatives, including interest-rate
swaps, options, and forward mortgage-backed and futures
contracts. As interest rates change, these financial instruments
are expected to have changes in fair value negatively
correlated to the change in fair value of the hedged residential
MSRs portfolio. The hedge relationships are actively managed
in response to changing market conditions over the life of the
residential MSRs assets. Commercial MSRs are economically
hedged at a macro level or with specific derivatives to protect
against a significant decline in interest rates. Selecting
appropriate financial instruments to economically hedge
residential or commercial MSRs requires significant
management judgment to assess how mortgage rates and
prepayment speeds could affect the future values of MSRs.
Hedging results can frequently be less predictable in the short
term, but over longer periods of time are expected to protect
the economic value of the MSRs.
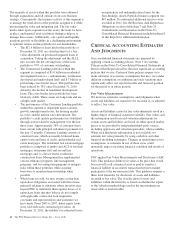
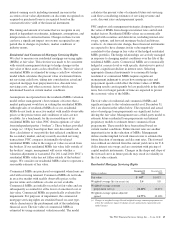
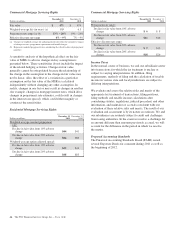
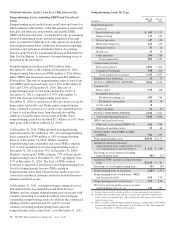
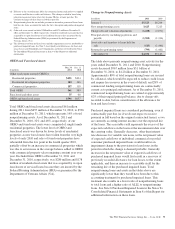
The fair value of residential and commercial MSRs and
significant inputs to the valuation model as of December 31,
2011 are shown in the tables below. The expected and actual
rates of mortgage loan prepayments are significant factors
driving the fair value. Management uses a third-party model to
estimate future residential loan prepayments and internal
proprietary models to estimate future commercial loan
prepayments. These models have been refined based on
current market conditions. Future interest rates are another
important factor in the valuation of MSRs. Management
utilizes market implied forward interest rates to estimate the
future direction of mortgage and discount rates. The forward
rates utilized are derived from the current yield curve for U.S.
dollar interest rate swaps and are consistent with pricing of
capital markets instruments. Changes in the shape and slope of
the forward curve in future periods may result in volatility in
the fair value estimate.
Residential Mortgage Servicing Rights
Dollars in millions
December 31
2011
December 31
2010
Fair value $ 647 $1,033
Weighted-average life (in years) (a) 3.6 5.8
Weighted-average constant
prepayment rate (a) 22.10% 12.61%
Weighted-average option adjusted
spread 11.77% 12.18%
(a) Changes in weighted-average life and weighted-average constant prepayment rate
reflect the cumulative impact of changes in rates, prepayment expectations and
model changes.
The PNC Financial Services Group, Inc. – Form 10-K 65