PNC Bank 2011 Annual Report Download - page 47
Download and view the complete annual report
Please find page 47 of the 2011 PNC Bank annual report below. You can navigate through the pages in the report by either clicking on the pages listed below, or by using the keyword search tool below to find specific information within the annual report.-
 1
1 -
2
-
3
-
4
-
5
-
6
-
7
-
8
-
9
-
10
-
11
-
12
-
13
-
14
-
15
-
16
-
17
-
18
-
19
-
20
-
21
-
22
-
23
-
24
-
25
-
26
-
27
-
28
-
29
-
30
-
31
-
32
-
33
-
34
-
35
-
36
-
 37
37 -
 38
38 -
 39
39 -
 40
40 -
 41
41 -
 42
42 -
 43
43 -
 44
44 -
 45
45 -
 46
46 -
 47
47 -
 48
48 -
 49
49 -
 50
50 -
 51
51 -
 52
52 -
 53
53 -
 54
54 -
 55
55 -
 56
56 -
 57
57 -
58
-
59
-
60
-
61
-
62
-
63
-
64
-
65
-
66
-
67
-
68
-
69
-
70
-
71
-
72
-
73
-
74
-
75
-
76
-
77
-
78
-
79
-
80
-
81
-
82
-
83
-
84
-
85
-
86
-
87
-
88
-
89
-
90
-
91
-
92
-
93
-
94
-
95
-
96
-
97
-
98
-
99
-
100
-
101
-
102
-
103
-
104
-
105
-
106
-
107
-
108
-
109
-
110
-
111
-
112
-
113
-
114
-
115
-
116
-
117
-
118
-
119
-
120
-
121
-
122
-
123
-
124
-
125
-
126
-
127
-
128
-
129
-
130
-
131
-
132
-
133
-
134
-
135
-
136
-
137
-
138
-
139
-
140
-
141
-
142
-
143
-
144
-
145
-
146
-
147
-
148
-
149
-
150
-
151
-
152
-
153
-
154
-
155
-
156
-
157
-
158
-
159
-
160
-
161
-
162
-
163
-
164
-
165
-
166
-
167
-
168
-
169
-
170
-
171
-
172
-
173
-
174
-
175
-
176
-
177
-
178
-
179
-
180
-
181
-
182
-
183
-
184
-
185
-
186
-
187
-
188
-
189
-
190
-
191
-
192
-
193
-
194
-
195
-
196
-
197
-
198
-
199
-
200
-
201
-
202
-
203
-
204
-
205
-
206
-
207
-
208
-
209
-
210
-
211
-
212
-
213
-
214
-
215
-
216
-
217
-
218
-
219
-
220
-
221
-
222
-
223
-
224
-
225
-
226
-
227
-
228
-
229
-
230
-
231
-
232
-
233
-
234
-
235
-
236
-
237
-
238
 |
 |

C
ONSOLIDATED
B
ALANCE
S
HEET
R
EVIEW
S
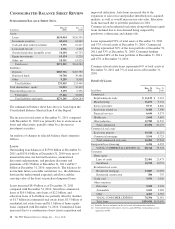
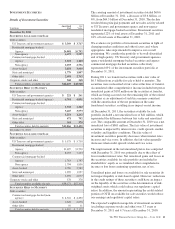
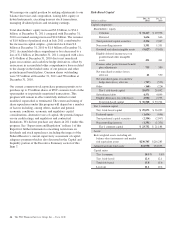
UMMARIZED
B
ALANCE
S
HEET
D
ATA
In millions
Dec. 31
2011
Dec. 31
2010
Assets
Loans $159,014 $150,595
Investment securities 60,634 64,262
Cash and short-term investments 9,992 10,437
Loans held for sale 2,936 3,492
Goodwill and other intangible assets 10,144 10,753
Equity investments 10,134 9,220
Other, net 18,351 15,525
Total assets $271,205 $264,284
Liabilities
Deposits $187,966 $183,390
Borrowed funds 36,704 39,488
Other 9,289 8,568
Total liabilities 233,959 231,446
Total shareholders’ equity 34,053 30,242
Noncontrolling interests 3,193 2,596
Total equity 37,246 32,838
Total liabilities and equity $271,205 $264,284
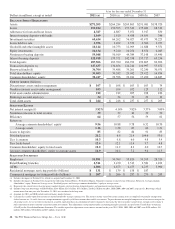
The summarized balance sheet data above is based upon the
Consolidated Balance Sheet in Item 8 of this Report.
The increase in total assets at December 31, 2011 compared
with December 31, 2010 was primarily due to an increase in
loans and other assets, partially offset by a decrease in
investment securities.
An analysis of changes in selected balance sheet categories
follows.
L
OANS
Outstanding loan balances of $159.0 billion at December 31,
2011 and $150.6 billion at December 31, 2010 were net of
unearned income, net deferred loan fees, unamortized
discounts and premiums, and purchase discounts and
premiums of $2.3 billion at December 31, 2011 and $2.7
billion at December 31, 2010, respectively. The balances do
not include future accretable net interest (i.e., the difference
between the undiscounted expected cash flows and the
carrying value of the loan) on purchased impaired loans.
Loans increased $8.4 billion as of December 31, 2011
compared with December 31, 2010. Growth in commercial
loans of $10.5 billion, auto loans of $2.2 billion, and
education loans of $.4 billion was partially offset by declines
of $1.7 billion in commercial real estate loans, $1.5 billion of
residential real estate loans and $1.1 billion of home equity
loans compared with December 31, 2010. Commercial loans
increased due to a combination of new client acquisition and
improved utilization. Auto loans increased due to the
expansion of sales force and product introduction to acquired
markets, as well as overall increases in auto sales. Education
loans increased due to portfolio purchases in 2011.
Commercial and residential real estate along with home equity
loans declined due to loan demand being outpaced by
paydowns, refinancing, and charge-offs.
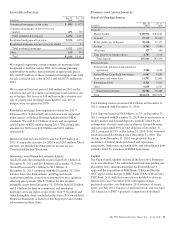
Loans represented 59% of total assets at December 31, 2011
and 57% of total assets at December 31, 2010. Commercial
lending represented 56% of the loan portfolio at December 31,
2011 and 53% at December 31, 2010. Consumer lending
represented 44% of the loan portfolio at December 31, 2011
and 47% at December 31, 2010.
Commercial real estate loans represented 6% of total assets at
December 31, 2011 and 7% of total assets at December 31,
2010.
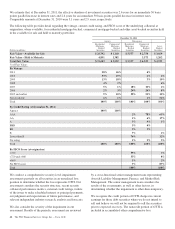
Details Of Loans
In millions
Dec. 31
2011
Dec. 31
2010
Commercial
Retail/wholesale trade $ 11,539 $ 9,901
Manufacturing 11,453 9,334
Service providers 9,717 8,866
Real estate related (a) 8,488 7,500
Financial services 6,646 4,573
Health care 5,068 3,481
Other industries 12,783 11,522
Total commercial 65,694 55,177
Commercial real estate
Real estate projects 10,640 12,211
Commercial mortgage 5,564 5,723
Total commercial real estate 16,204 17,934
Equipment lease financing 6,416 6,393
TOTAL COMMERCIAL LENDING (b) 88,314 79,504
Consumer
Home equity
Lines of credit 22,491 23,473
Installment 10,598 10,753
Residential real estate
Residential mortgage 13,885 15,292
Residential construction 584 707
Credit card 3,976 3,920
Other consumer
Education 9,582 9,196
Automobile 5,181 2,983
Other 4,403 4,767
TOTAL CONSUMER LENDING 70,700 71,091
Total loans $159,014 $150,595
(a) Includes loans to customers in the real estate and construction industries.
(b) Construction loans with interest reserves, and A/B Note restructurings are not
significant to PNC.
38 The PNC Financial Services Group, Inc. – Form 10-K