PNC Bank 2011 Annual Report Download - page 113
Download and view the complete annual report
Please find page 113 of the 2011 PNC Bank annual report below. You can navigate through the pages in the report by either clicking on the pages listed below, or by using the keyword search tool below to find specific information within the annual report.-
 1
1 -
2
-
3
-
4
-
5
-
6
-
7
-
8
-
9
-
10
-
11
-
12
-
13
-
14
-
15
-
16
-
17
-
18
-
19
-
20
-
21
-
22
-
23
-
24
-
25
-
26
-
27
-
28
-
29
-
30
-
31
-
32
-
33
-
34
-
35
-
36
-
37
-
38
-
39
-
40
-
41
-
42
-
43
-
44
-
45
-
46
-
47
-
48
-
49
-
50
-
51
-
52
-
53
-
54
-
55
-
56
-
57
-
58
-
59
-
60
-
61
-
62
-
63
-
64
-
65
-
66
-
67
-
68
-
69
-
70
-
71
-
72
-
73
-
74
-
75
-
76
-
77
-
78
-
79
-
80
-
81
-
82
-
83
-
84
-
85
-
86
-
87
-
88
-
89
-
90
-
91
-
92
-
93
-
94
-
95
-
96
-
97
-
98
-
99
-
100
-
101
-
102
-
 103
103 -
 104
104 -
 105
105 -
 106
106 -
 107
107 -
 108
108 -
 109
109 -
 110
110 -
 111
111 -
 112
112 -
 113
113 -
 114
114 -
 115
115 -
 116
116 -
 117
117 -
 118
118 -
 119
119 -
 120
120 -
 121
121 -
 122
122 -
 123
123 -
124
-
125
-
126
-
127
-
128
-
129
-
130
-
131
-
132
-
133
-
134
-
135
-
136
-
137
-
138
-
139
-
140
-
141
-
142
-
143
-
144
-
145
-
146
-
147
-
148
-
149
-
150
-
151
-
152
-
153
-
154
-
155
-
156
-
157
-
158
-
159
-
160
-
161
-
162
-
163
-
164
-
165
-
166
-
167
-
168
-
169
-
170
-
171
-
172
-
173
-
174
-
175
-
176
-
177
-
178
-
179
-
180
-
181
-
182
-
183
-
184
-
185
-
186
-
187
-
188
-
189
-
190
-
191
-
192
-
193
-
194
-
195
-
196
-
197
-
198
-
199
-
200
-
201
-
202
-
203
-
204
-
205
-
206
-
207
-
208
-
209
-
210
-
211
-
212
-
213
-
214
-
215
-
216
-
217
-
218
-
219
-
220
-
221
-
222
-
223
-
224
-
225
-
226
-
227
-
228
-
229
-
230
-
231
-
232
-
233
-
234
-
235
-
236
-
237
-
238
 |
 |

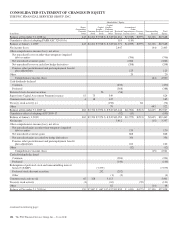
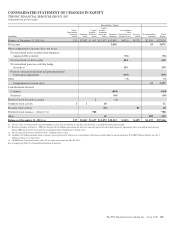
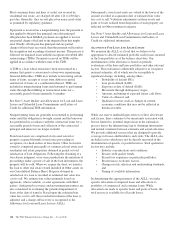
CONSOLIDATED STATEMENT OF CHANGES IN EQUITY
THE PNC FINANCIAL SERVICES GROUP, INC.
Shareholders’ Equity
In millions
Shares
Outstanding
Common
Stock
Common
Stock
Capital
Surplus -
Preferred
Stock
Capital
Surplus -
Common
Stock and
Other
Retained
Earnings
Accumulated
Other
Comprehensive
Income (Loss)
Treasury
Stock
Noncontrolling
Interests
Total
Equity
Balance at December 31, 2008 (a) 443 $2,261 $7,918 $ 8,328 $11,461 $(3,949) $(597) $2,226 $27,648
Cumulative effect of adopting FASB ASC 320-10 (b) 110 (110)
Balance at January 1, 2009 443 $2,261 $7,918 $ 8,328 $11,571 $(4,059) $(597) $2,226 $27,648
Net income (loss) 2,447 (44) 2,403
Other comprehensive income (loss), net of tax
Net unrealized losses on other-than-temporary impaired
debt securities (706) (706)
Net unrealized securities gains 2,866 2,866
Net unrealized losses on cash flow hedge derivatives (208) (208)
Pension, other postretirement and postemployment benefit
plan adjustments 125 125
Other 20 20
Comprehensive income (loss) (44) 4,500
Cash dividends declared
Common (430) (430)
Preferred (388) (388)
Preferred stock discount accretion 56 (56)
Supervisory Capital Assessment Program issuance 15 75 549 624
Common stock activity 4 18 147 165
Treasury stock activity (c) (158) 84 (74)
Other 79 443 522
Balance at December 31, 2009 (a) 462 $2,354 $7,974 $ 8,945 $13,144 $(1,962) $(513) $2,625 $32,567
Cumulative effect of adopting ASU 2009-17 (92) (13) (105)
Balance at January 1, 2010 462 $2,354 $7,974 $ 8,945 $13,052 $(1,975) $(513) $2,625 $32,462
Net income 3,412 (15) 3,397
Other comprehensive income (loss), net of tax
Net unrealized gains on other-than-temporary impaired
debt securities 170 170
Net unrealized securities gains 868 868
Net unrealized gains on cash flow hedge derivatives 356 356
Pension, other postretirement and postemployment benefit
plan adjustments 162 162
Other (12) (12)
Comprehensive income (loss) (15) 4,941
Cash dividends declared
Common (204) (204)
Preferred (146) (146)
Redemption of preferred stock and noncontrolling interest
Series N (TARP) (7,579) (7,579)
Preferred stock discount accretion 252 (252)
Other (1) (3) (4)
Common stock activity (d) 65 328 3,113 3,441
Treasury stock activity (1) (62) (59) (121)
Other 62 (14) 48
Balance at December 31, 2010 (a) 526 $2,682 $ 647 $12,057 $15,859 $ (431) $(572) $2,596 $32,838
104 The PNC Financial Services Group, Inc. – Form 10-K
(continued on following page)