PNC Bank 2011 Annual Report Download - page 146
Download and view the complete annual report
Please find page 146 of the 2011 PNC Bank annual report below. You can navigate through the pages in the report by either clicking on the pages listed below, or by using the keyword search tool below to find specific information within the annual report.-
 1
1 -
2
-
3
-
4
-
5
-
6
-
7
-
8
-
9
-
10
-
11
-
12
-
13
-
14
-
15
-
16
-
17
-
18
-
19
-
20
-
21
-
22
-
23
-
24
-
25
-
26
-
27
-
28
-
29
-
30
-
31
-
32
-
33
-
34
-
35
-
36
-
37
-
38
-
39
-
40
-
41
-
42
-
43
-
44
-
45
-
46
-
47
-
48
-
49
-
50
-
51
-
52
-
53
-
54
-
55
-
56
-
57
-
58
-
59
-
60
-
61
-
62
-
63
-
64
-
65
-
66
-
67
-
68
-
69
-
70
-
71
-
72
-
73
-
74
-
75
-
76
-
77
-
78
-
79
-
80
-
81
-
82
-
83
-
84
-
85
-
86
-
87
-
88
-
89
-
90
-
91
-
92
-
93
-
94
-
95
-
96
-
97
-
98
-
99
-
100
-
101
-
102
-
103
-
104
-
105
-
106
-
107
-
108
-
109
-
110
-
111
-
112
-
113
-
114
-
115
-
116
-
117
-
118
-
119
-
120
-
121
-
122
-
123
-
124
-
125
-
126
-
127
-
128
-
129
-
130
-
131
-
132
-
133
-
134
-
135
-
 136
136 -
 137
137 -
 138
138 -
 139
139 -
 140
140 -
 141
141 -
 142
142 -
 143
143 -
 144
144 -
 145
145 -
 146
146 -
 147
147 -
 148
148 -
 149
149 -
 150
150 -
 151
151 -
 152
152 -
 153
153 -
 154
154 -
 155
155 -
 156
156 -
157
-
158
-
159
-
160
-
161
-
162
-
163
-
164
-
165
-
166
-
167
-
168
-
169
-
170
-
171
-
172
-
173
-
174
-
175
-
176
-
177
-
178
-
179
-
180
-
181
-
182
-
183
-
184
-
185
-
186
-
187
-
188
-
189
-
190
-
191
-
192
-
193
-
194
-
195
-
196
-
197
-
198
-
199
-
200
-
201
-
202
-
203
-
204
-
205
-
206
-
207
-
208
-
209
-
210
-
211
-
212
-
213
-
214
-
215
-
216
-
217
-
218
-
219
-
220
-
221
-
222
-
223
-
224
-
225
-
226
-
227
-
228
-
229
-
230
-
231
-
232
-
233
-
234
-
235
-
236
-
237
-
238
 |
 |
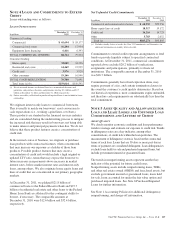
A
LLOWANCES FOR
L
OAN AND
L
EASE
L
OSSES AND
U
NFUNDED
L
OAN
C
OMMITMENTS AND
L
ETTERS OF
C
REDIT
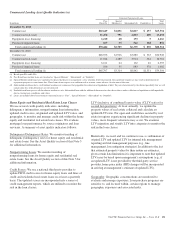
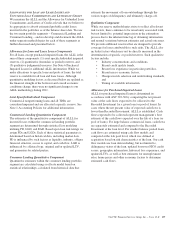
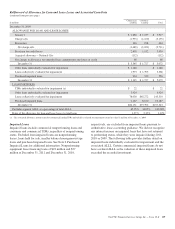
We maintain the ALLL and the Allowance for Unfunded Loan
Commitments and Letters of Credit at levels that we believe to
be appropriate to absorb estimated probable credit losses
incurred in the portfolios as of the balance sheet date. We use
the two main portfolio segments – Commercial Lending and
Consumer Lending – and we develop and document the ALLL
under separate methodologies for each of these segments as
further discussed and presented below.
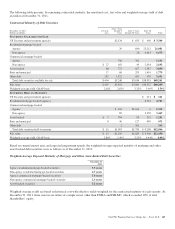
Allowance for Loan and Lease Losses Components
For all loans, except purchased impaired loans, the ALLL is the
sum of three components: (1) asset specific/individual impaired
reserves, (2) quantitative (formulaic or pooled) reserves, and
(3) qualitative (judgmental) reserves. See Note 6 Purchased
Impaired Loans for additional ALLL information. While we
make allocations to specific loans and pools of loans, the total
reserve is available for all loan and lease losses. Although
quantitative modeling factors as discussed below are updated as
the financial strength of the borrower and overall economic
conditions change, there were no significant changes to our
ALLL methodology during 2011.
Asset Specific/Individual Component
Commercial nonperforming loans and all TDRs are
considered impaired and are allocated a specific reserve. See
Note 1 Accounting Policies for additional information.
Commercial Lending Quantitative Component
The estimates of the quantitative component of ALLL for
incurred losses within the commercial lending portfolio
segment are determined through statistical loss modeling
utilizing PD, LGD, and EAD. Based upon loan risk ratings we
assign PDs and LGDs. Each of these statistical parameters is
determined based on historical data, including market data.
PD is influenced by such factors as liquidity, industry, obligor
financial structure, access to capital, and cash flow. LGD is
influenced by collateral type, original and/or updated LTV,
and guarantees by related parties.
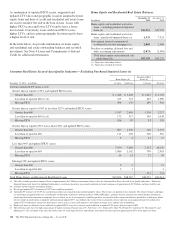
Consumer Lending Quantitative Component
Quantitative estimates within the consumer lending portfolio
segment are calculated using a roll-rate model based on
statistical relationships, calculated from historical data that
estimate the movement of loan outstandings through the
various stages of delinquency and ultimately charge-off.
Qualitative Component
While our reserve methodologies strive to reflect all relevant
risk factors, there continues to be uncertainty associated with,
but not limited to, potential imprecision in the estimation
process due to the inherent time lag of obtaining information
and normal variations between estimates and actual outcomes.
We provide additional reserves that are designed to provide
coverage for losses attributable to such risks. The ALLL also
includes factors which may not be directly measured in the
determination of specific or pooled reserves. Such qualitative
factors include:
• Industry concentrations and conditions,
• Recent credit quality trends,
• Recent loss experience in particular portfolios,
• Recent macro economic factors,
• Changes in risk selection and underwriting standards,
and
• Timing of available information.
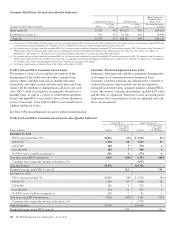
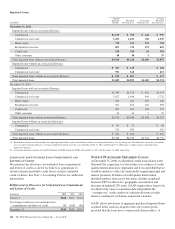
Allowance for Purchased Impaired Loans
ALLL for purchased impaired loans is determined in
accordance with ASC 310-30 by comparing the net present
value of the cash flows expected to be collected to the
Recorded Investment for a given loan (or pool of loans). In
cases where the net present value of expected cash flows is
lower than Recorded Investment, ALLL is established. Cash
flows expected to be collected represent management’s best
estimate of the cash flows expected over the life of a loan (or
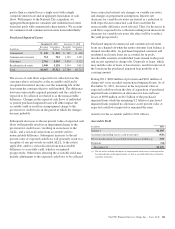
pool of loans). For large balance commercial loans, cash flows
are separately estimated and compared to the Recorded
Investment at the loan level. For smaller balance pooled loans,
cash flows are estimated using cash flow models and
compared at the risk pool level, which was defined at
acquisition based on risk characteristics of the loan. Our cash
flow models use loan data including, but not limited to,
delinquency status of the loan, updated borrower FICO credit
scores, geographic information, historical loss experience, and
updated LTVs, as well as best estimates for unemployment
rates, home prices and other economic factors to determine
estimated cash flows.
The PNC Financial Services Group, Inc. – Form 10-K 137