PNC Bank 2011 Annual Report Download - page 170
Download and view the complete annual report
Please find page 170 of the 2011 PNC Bank annual report below. You can navigate through the pages in the report by either clicking on the pages listed below, or by using the keyword search tool below to find specific information within the annual report.-
 1
1 -
2
-
3
-
4
-
5
-
6
-
7
-
8
-
9
-
10
-
11
-
12
-
13
-
14
-
15
-
16
-
17
-
18
-
19
-
20
-
21
-
22
-
23
-
24
-
25
-
26
-
27
-
28
-
29
-
30
-
31
-
32
-
33
-
34
-
35
-
36
-
37
-
38
-
39
-
40
-
41
-
42
-
43
-
44
-
45
-
46
-
47
-
48
-
49
-
50
-
51
-
52
-
53
-
54
-
55
-
56
-
57
-
58
-
59
-
60
-
61
-
62
-
63
-
64
-
65
-
66
-
67
-
68
-
69
-
70
-
71
-
72
-
73
-
74
-
75
-
76
-
77
-
78
-
79
-
80
-
81
-
82
-
83
-
84
-
85
-
86
-
87
-
88
-
89
-
90
-
91
-
92
-
93
-
94
-
95
-
96
-
97
-
98
-
99
-
100
-
101
-
102
-
103
-
104
-
105
-
106
-
107
-
108
-
109
-
110
-
111
-
112
-
113
-
114
-
115
-
116
-
117
-
118
-
119
-
120
-
121
-
122
-
123
-
124
-
125
-
126
-
127
-
128
-
129
-
130
-
131
-
132
-
133
-
134
-
135
-
136
-
137
-
138
-
139
-
140
-
141
-
142
-
143
-
144
-
145
-
146
-
147
-
148
-
149
-
150
-
151
-
152
-
153
-
154
-
155
-
156
-
157
-
158
-
159
-
 160
160 -
 161
161 -
 162
162 -
 163
163 -
 164
164 -
 165
165 -
 166
166 -
 167
167 -
 168
168 -
 169
169 -
 170
170 -
 171
171 -
 172
172 -
 173
173 -
 174
174 -
 175
175 -
 176
176 -
 177
177 -
 178
178 -
 179
179 -
 180
180 -
181
-
182
-
183
-
184
-
185
-
186
-
187
-
188
-
189
-
190
-
191
-
192
-
193
-
194
-
195
-
196
-
197
-
198
-
199
-
200
-
201
-
202
-
203
-
204
-
205
-
206
-
207
-
208
-
209
-
210
-
211
-
212
-
213
-
214
-
215
-
216
-
217
-
218
-
219
-
220
-
221
-
222
-
223
-
224
-
225
-
226
-
227
-
228
-
229
-
230
-
231
-
232
-
233
-
234
-
235
-
236
-
237
-
238
 |
 |

prepayments. These models have been refined based on
current market conditions. Future interest rates are another
important factor in the valuation of MSRs. Management
utilizes market implied forward interest rates to estimate the
future direction of mortgage and discount rates. The forward
rates utilized are derived from the current yield curve for U.S.
dollar interest rate swaps and are consistent with pricing of
capital markets instruments. Changes in the shape and slope of
the forward curve in future periods may result in volatility in
the fair value estimate.
A sensitivity analysis of the hypothetical effect on the fair
value of MSRs to adverse changes in key assumptions is
presented below. These sensitivities do not include the impact
of the related hedging activities. Changes in fair value
generally cannot be extrapolated because the relationship of
the change in the assumption to the change in fair value may
not be linear. Also, the effect of a variation in a particular
assumption on the fair value of the MSRs is calculated
independently without changing any other assumption. In
reality, changes in one factor may result in changes in another
(for example, changes in mortgage interest rates, which drive
changes in prepayment rate estimates, could result in changes
in the interest rate spread), which could either magnify or
counteract the sensitivities.
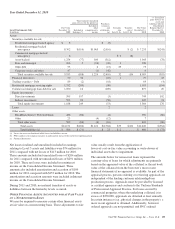
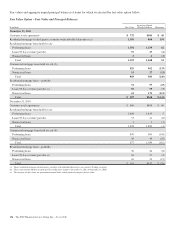
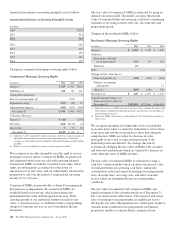
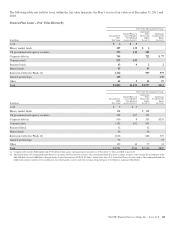
The following tables set forth the fair value of commercial and
residential MSRs and the sensitivity analysis of the
hypothetical effect on the fair value of MSRs to immediate
adverse changes of 10% and 20% in those assumptions:
Commercial Mortgage Servicing Rights – Key Valuation
Assumptions
Dollars in millions
December 31
2011
December 31
2010
Fair value $471 $674
Weighted-average life (years) 5.9 6.3
Prepayment rate range (a) 13%-28% 10%-24%
Decline in fair value from 10% adverse
change $6 $8
Decline in fair value from 20% adverse
change $11 $16
Effective discount rate range 6%-9% 7%-9%
Decline in fair value from 10% adverse
change $9 $13
Decline in fair value from 20% adverse
change $18 $26
(a) Represents modeled prepayment rates considering the effective dates of prepayment
penalties.
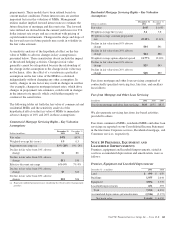
Residential Mortgage Servicing Rights – Key Valuation
Assumptions
Dollars in millions
December 31
2011
December 31
2010
Fair value $647 $1,033
Weighted-average life (years) 3.6 5.8
Weighted-average constant prepayment
rate 22.10% 12.61%
Decline in fair value from 10% adverse
change $44 $41
Decline in fair value from 20% adverse
change $84 $86
Weighted-average option adjusted spread 11.77% 12.18%
Decline in fair value from 10% adverse
change $25 $43
Decline in fair value from 20% adverse
change $48 $83
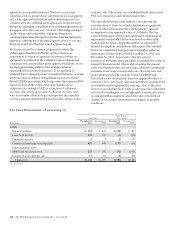
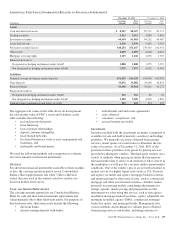
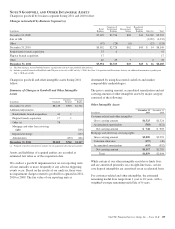
Fees from mortgage and other loan servicing comprised of
contractually specified servicing fees, late fees, and ancillary
fees follows:
Fees from Mortgage and Other Loan Servicing
In millions 2011 2010 2009
Fees from mortgage and other loan servicing $641 $692 $825
We also generate servicing fees from fee-based activities
provided to others.
Fees from commercial MSRs, residential MSRs and other loan
servicing are reported on our Consolidated Income Statement
in the line items Corporate services, Residential mortgage, and
Consumer services, respectively.
N
OTE
10 P
REMISES
,E
QUIPMENT AND
L
EASEHOLD
I
MPROVEMENTS
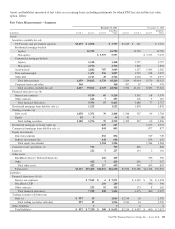
Premises, equipment and leasehold improvements, stated at
cost less accumulated depreciation and amortization, were as
follows:
Premises, Equipment and Leasehold Improvements
December 31 - in millions 2011 2010
Land $ 690 $ 659
Buildings 1,955 1,644
Equipment 3,894 3,335
Leasehold improvements 651 593
Total 7,190 6,231
Accumulated depreciation and amortization (2,546) (2,172)
Net book value $ 4,644 $ 4,059
The PNC Financial Services Group, Inc. – Form 10-K 161