PNC Bank 2011 Annual Report Download - page 49
Download and view the complete annual report
Please find page 49 of the 2011 PNC Bank annual report below. You can navigate through the pages in the report by either clicking on the pages listed below, or by using the keyword search tool below to find specific information within the annual report.-
 1
1 -
2
-
3
-
4
-
5
-
6
-
7
-
8
-
9
-
10
-
11
-
12
-
13
-
14
-
15
-
16
-
17
-
18
-
19
-
20
-
21
-
22
-
23
-
24
-
25
-
26
-
27
-
28
-
29
-
30
-
31
-
32
-
33
-
34
-
35
-
36
-
37
-
38
-
 39
39 -
 40
40 -
 41
41 -
 42
42 -
 43
43 -
 44
44 -
 45
45 -
 46
46 -
 47
47 -
 48
48 -
 49
49 -
 50
50 -
 51
51 -
 52
52 -
 53
53 -
 54
54 -
 55
55 -
 56
56 -
 57
57 -
 58
58 -
 59
59 -
60
-
61
-
62
-
63
-
64
-
65
-
66
-
67
-
68
-
69
-
70
-
71
-
72
-
73
-
74
-
75
-
76
-
77
-
78
-
79
-
80
-
81
-
82
-
83
-
84
-
85
-
86
-
87
-
88
-
89
-
90
-
91
-
92
-
93
-
94
-
95
-
96
-
97
-
98
-
99
-
100
-
101
-
102
-
103
-
104
-
105
-
106
-
107
-
108
-
109
-
110
-
111
-
112
-
113
-
114
-
115
-
116
-
117
-
118
-
119
-
120
-
121
-
122
-
123
-
124
-
125
-
126
-
127
-
128
-
129
-
130
-
131
-
132
-
133
-
134
-
135
-
136
-
137
-
138
-
139
-
140
-
141
-
142
-
143
-
144
-
145
-
146
-
147
-
148
-
149
-
150
-
151
-
152
-
153
-
154
-
155
-
156
-
157
-
158
-
159
-
160
-
161
-
162
-
163
-
164
-
165
-
166
-
167
-
168
-
169
-
170
-
171
-
172
-
173
-
174
-
175
-
176
-
177
-
178
-
179
-
180
-
181
-
182
-
183
-
184
-
185
-
186
-
187
-
188
-
189
-
190
-
191
-
192
-
193
-
194
-
195
-
196
-
197
-
198
-
199
-
200
-
201
-
202
-
203
-
204
-
205
-
206
-
207
-
208
-
209
-
210
-
211
-
212
-
213
-
214
-
215
-
216
-
217
-
218
-
219
-
220
-
221
-
222
-
223
-
224
-
225
-
226
-
227
-
228
-
229
-
230
-
231
-
232
-
233
-
234
-
235
-
236
-
237
-
238
 |
 |

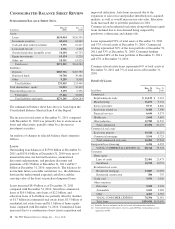
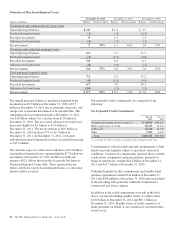
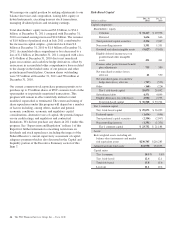
Valuation of Purchased Impaired Loans
December 31, 2011 December 31, 2010 December 31, 2009
Dollars in billions Balance Net Investment Balance Net Investment Balance Net Investment
Commercial and commercial real estate loans:
Unpaid principal balance $ 1.0 $ 1.8 $ 3.5
Purchased impaired mark (.1) (.4) (1.3)
Recorded investment .9 1.4 2.2
Allowance for loan losses (.2) (.3) (.2)
Net investment .7 70% 1.1 61% 2.0 57%
Consumer and residential mortgage loans:
Unpaid principal balance 6.5 7.9 11.7
Purchased impaired mark (.7) (1.5) (3.6)
Recorded investment 5.8 6.4 8.1
Allowance for loan losses (.8) (.6) (.3)
Net investment 5.0 77% 5.8 73% 7.8 67%
Total purchased impaired loans:
Unpaid principal balance 7.5 9.7 15.2
Purchased impaired mark (.8) (1.9) (4.9)
Recorded investment 6.7 7.8 10.3
Allowance for loan losses (1.0) (.9) (.5)
Net investment $ 5.7 76% $ 6.9 71% $ 9.8 64%
The unpaid principal balance of purchased impaired loans
declined from $9.7 billion at December 31, 2010 to $7.5
billion at December 31, 2011 due to payments, disposals, and
charge-offs of amounts determined to be uncollectible. The
remaining purchased impaired mark at December 31, 2011
was $.8 billion, which was a decline from $1.9 billion at
December 31, 2010. The associated allowance for loan losses
increased slightly by $.1 billion to $1.0 billion at
December 31, 2011. The net investment of $6.9 billion at
December 31, 2010 declined 17% to $5.7 billion at
December 31, 2011. At December 31, 2011, our largest
individual purchased impaired loan had a recorded investment
of $25.2 million.
We currently expect to collect total cash flows of $7.8 billion
on purchased impaired loans, representing the $5.7 billion net
investment at December 31, 2011 and the accretable net
interest of $2.1 billion shown in the Accretable Net Interest-
Purchased Impaired Loans table. These represent the net
future cash flows on purchased impaired loans, as contractual
interest will be reversed.
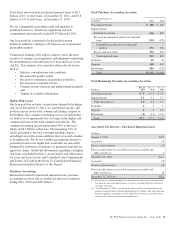
Net unfunded credit commitments are comprised of the
following:
Net Unfunded Credit Commitments
Dec. 31
2011
Dec. 31
2010
Commercial/commercial real estate (a) $ 64,955 $59,256
Home equity lines of credit 18,317 19,172
Credit card 16,216 14,725
Other 3,783 2,652
Total $103,271 $95,805
(a) Less than 4% of these amounts at each date relate to commercial real estate.
Commitments to extend credit represent arrangements to lend
funds or provide liquidity subject to specified contractual
conditions. Commercial commitments reported above exclude
syndications, assignments and participations, primarily to
financial institutions, totaling $20.2 billion at December 31,
2011 and $16.7 billion at December 31, 2010.
Unfunded liquidity facility commitments and standby bond
purchase agreements totaled $742 million at December 31,
2011 and $458 million at December 31, 2010 and are included
in the preceding table primarily within the Commercial /
commercial real estate category.
In addition to the credit commitments set forth in the table
above, our net outstanding standby letters of credit totaled
$10.8 billion at December 31, 2011 and $10.1 billion at
December 31, 2010. Standby letters of credit commit us to
make payments on behalf of our customers if specified future
events occur.
40 The PNC Financial Services Group, Inc. – Form 10-K