PNC Bank 2011 Annual Report Download - page 161
Download and view the complete annual report
Please find page 161 of the 2011 PNC Bank annual report below. You can navigate through the pages in the report by either clicking on the pages listed below, or by using the keyword search tool below to find specific information within the annual report.-
 1
1 -
2
-
3
-
4
-
5
-
6
-
7
-
8
-
9
-
10
-
11
-
12
-
13
-
14
-
15
-
16
-
17
-
18
-
19
-
20
-
21
-
22
-
23
-
24
-
25
-
26
-
27
-
28
-
29
-
30
-
31
-
32
-
33
-
34
-
35
-
36
-
37
-
38
-
39
-
40
-
41
-
42
-
43
-
44
-
45
-
46
-
47
-
48
-
49
-
50
-
51
-
52
-
53
-
54
-
55
-
56
-
57
-
58
-
59
-
60
-
61
-
62
-
63
-
64
-
65
-
66
-
67
-
68
-
69
-
70
-
71
-
72
-
73
-
74
-
75
-
76
-
77
-
78
-
79
-
80
-
81
-
82
-
83
-
84
-
85
-
86
-
87
-
88
-
89
-
90
-
91
-
92
-
93
-
94
-
95
-
96
-
97
-
98
-
99
-
100
-
101
-
102
-
103
-
104
-
105
-
106
-
107
-
108
-
109
-
110
-
111
-
112
-
113
-
114
-
115
-
116
-
117
-
118
-
119
-
120
-
121
-
122
-
123
-
124
-
125
-
126
-
127
-
128
-
129
-
130
-
131
-
132
-
133
-
134
-
135
-
136
-
137
-
138
-
139
-
140
-
141
-
142
-
143
-
144
-
145
-
146
-
147
-
148
-
149
-
150
-
 151
151 -
 152
152 -
 153
153 -
 154
154 -
 155
155 -
 156
156 -
 157
157 -
 158
158 -
 159
159 -
 160
160 -
 161
161 -
 162
162 -
 163
163 -
 164
164 -
 165
165 -
 166
166 -
 167
167 -
 168
168 -
 169
169 -
 170
170 -
 171
171 -
172
-
173
-
174
-
175
-
176
-
177
-
178
-
179
-
180
-
181
-
182
-
183
-
184
-
185
-
186
-
187
-
188
-
189
-
190
-
191
-
192
-
193
-
194
-
195
-
196
-
197
-
198
-
199
-
200
-
201
-
202
-
203
-
204
-
205
-
206
-
207
-
208
-
209
-
210
-
211
-
212
-
213
-
214
-
215
-
216
-
217
-
218
-
219
-
220
-
221
-
222
-
223
-
224
-
225
-
226
-
227
-
228
-
229
-
230
-
231
-
232
-
233
-
234
-
235
-
236
-
237
-
238
 |
 |

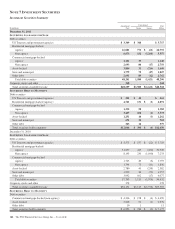
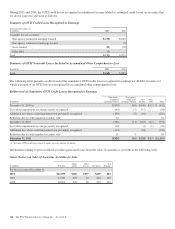
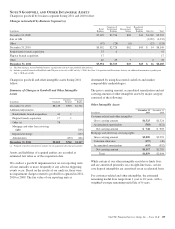
(a) Included in Other assets on our Consolidated Balance Sheet.
(b) Amounts at December 31, 2011 and December 31, 2010 are presented gross and are not reduced by the impact of legally enforceable master netting agreements that allow PNC to net
positive and negative positions and cash collateral held or placed with the same counterparty. At December 31, 2011 and December 31, 2010, respectively, the net asset amounts were
$2.4 billion and $1.9 billion and the net liability amounts were $.7 billion and $1.1 billion.
(c) Included in Loans held for sale on our Consolidated Balance Sheet. PNC has elected the fair value option for certain commercial and residential mortgage loans held for sale.
(d) Fair value includes net unrealized gains of $102 million at December 31, 2011 compared with net unrealized losses of $17 million at December 31, 2010.
(e) Approximately 57% of these securities are residential mortgage-backed securities and 34% are US Treasury and government agencies securities at December 31, 2011. Comparable
amounts at December 31, 2010 were 4% and 74%, respectively.
(f) At December 31, 2011, $1.1 billion of residential mortgage-backed agency securities with embedded derivatives were carried in Trading securities.
(g) Included in Other intangible assets on our Consolidated Balance Sheet.
(h) The indirect equity funds are not redeemable, but PNC receives distributions over the life of the partnership from liquidation of the underlying investments by the investee.
(i) Included in Federal funds sold and resale agreements on our Consolidated Balance Sheet. PNC has elected the fair value option for these items.
(j) Included in Loans on our Consolidated Balance Sheet.
(k) PNC has elected the fair value option for these shares.
(l) Included in Other liabilities on our Consolidated Balance Sheet.
(m) Included in Other borrowed funds on our Consolidated Balance Sheet.
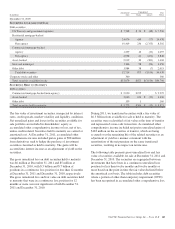
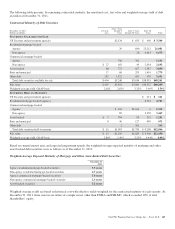
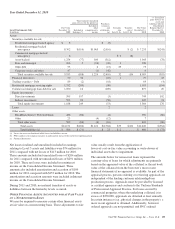
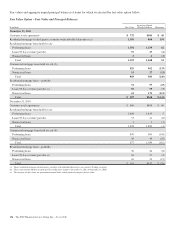
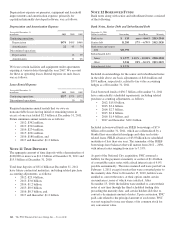
Reconciliations of assets and liabilities measured at fair value on a recurring basis using Level 3 inputs for 2011 and 2010 follow.
Year Ended December 31, 2011
Level 3 Instruments Only
In millions
Fair Value
Dec. 31,
2010
Total realized / unrealized
gains (losses) for the period (a)
Purchases Sales Issuances Settlements
Transfers
out of
Level 3 (b)
Fair Value
December 31,
2011
(*) Unrealized
gains (losses) on
assets and
liabilities held on
Consolidated
Balance Sheet at
December 31,
2011
Included in
Earnings (*)
Included in
other
comprehensive
income
Assets
Securities available for sale
Residential mortgage-
backed non-agency $ 7,233 $(80) $(157) $ 45 $(280) $(1,204) $ 5,557 $(130)
Asset-backed 1,045 (11) 21 48 (316) 787 (21)
State and municipal 228 10 121 (23) 336
Other debt 73 (2) 3 3 (3) 1 $(26) 49 (1)
Corporate stocks and
other 4 (4)
Total securities
available for sale 8,583 (93) (123) 217 (283) (1,546) (26) 6,729 (152)
Financial derivatives 77 263 5 (278) 67 188
Trading securities – Debt 69 4 (29) (5) 39 (5)
Residential mortgage
servicing rights 1,033 (406) 65 $118 (163) 647 (383)
Commercial mortgage
loans held for sale 877 3 (13) (24) 843 (4)
Equity investments
Direct investments 749 87 176 (156) 856 58
Indirect investments 635 89 66 (142) 648 91
Total equity
investments 1,384 176 242 (298) 1,504 149
Loans 2 4 (1) 5
Other assets
BlackRock Series C
Preferred Stock 396 (14) (172) 210 (14)
Other 7 1 (1) 7
Total other assets 403 (14) 1 (173) 217 (14)
Total assets $12,428 $(67) $(123) $534 $(594) $118 $(2,214) $(31) $10,051 $(221)
Total liabilities (c) $ 460 $ 7 $ 10 $ (169) $ 308 $ (17)
152 The PNC Financial Services Group, Inc. – Form 10-K