PNC Bank 2011 Annual Report Download - page 158
Download and view the complete annual report
Please find page 158 of the 2011 PNC Bank annual report below. You can navigate through the pages in the report by either clicking on the pages listed below, or by using the keyword search tool below to find specific information within the annual report.-
 1
1 -
2
-
3
-
4
-
5
-
6
-
7
-
8
-
9
-
10
-
11
-
12
-
13
-
14
-
15
-
16
-
17
-
18
-
19
-
20
-
21
-
22
-
23
-
24
-
25
-
26
-
27
-
28
-
29
-
30
-
31
-
32
-
33
-
34
-
35
-
36
-
37
-
38
-
39
-
40
-
41
-
42
-
43
-
44
-
45
-
46
-
47
-
48
-
49
-
50
-
51
-
52
-
53
-
54
-
55
-
56
-
57
-
58
-
59
-
60
-
61
-
62
-
63
-
64
-
65
-
66
-
67
-
68
-
69
-
70
-
71
-
72
-
73
-
74
-
75
-
76
-
77
-
78
-
79
-
80
-
81
-
82
-
83
-
84
-
85
-
86
-
87
-
88
-
89
-
90
-
91
-
92
-
93
-
94
-
95
-
96
-
97
-
98
-
99
-
100
-
101
-
102
-
103
-
104
-
105
-
106
-
107
-
108
-
109
-
110
-
111
-
112
-
113
-
114
-
115
-
116
-
117
-
118
-
119
-
120
-
121
-
122
-
123
-
124
-
125
-
126
-
127
-
128
-
129
-
130
-
131
-
132
-
133
-
134
-
135
-
136
-
137
-
138
-
139
-
140
-
141
-
142
-
143
-
144
-
145
-
146
-
147
-
 148
148 -
 149
149 -
 150
150 -
 151
151 -
 152
152 -
 153
153 -
 154
154 -
 155
155 -
 156
156 -
 157
157 -
 158
158 -
 159
159 -
 160
160 -
 161
161 -
 162
162 -
 163
163 -
 164
164 -
 165
165 -
 166
166 -
 167
167 -
 168
168 -
169
-
170
-
171
-
172
-
173
-
174
-
175
-
176
-
177
-
178
-
179
-
180
-
181
-
182
-
183
-
184
-
185
-
186
-
187
-
188
-
189
-
190
-
191
-
192
-
193
-
194
-
195
-
196
-
197
-
198
-
199
-
200
-
201
-
202
-
203
-
204
-
205
-
206
-
207
-
208
-
209
-
210
-
211
-
212
-
213
-
214
-
215
-
216
-
217
-
218
-
219
-
220
-
221
-
222
-
223
-
224
-
225
-
226
-
227
-
228
-
229
-
230
-
231
-
232
-
233
-
234
-
235
-
236
-
237
-
238
 |
 |
F
INANCIAL
I
NSTRUMENTS
A
CCOUNTED
F
OR AT
F
AIR
V
ALUE
ON A
R
ECURRING
B
ASIS
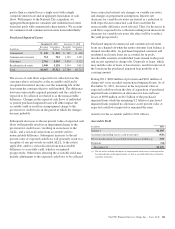
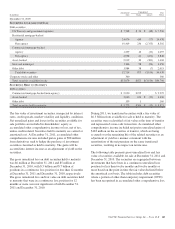
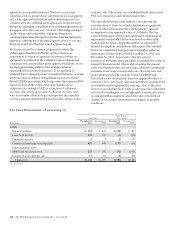
Securities Available for Sale and Trading Securities
Securities accounted for at fair value include both the
available for sale and trading portfolios. We primarily use
prices obtained from pricing services, dealer quotes, or recent
trades to determine the fair value of securities. As of
December 31, 2011, 86% of the positions in these portfolios
were priced by pricing services provided by third-party
vendors. The third-party vendors use a variety of methods
when pricing securities that incorporate relevant market data
to arrive at an estimate of what a buyer in the marketplace
would pay for a security under current market conditions. One
of the vendor’s prices are set with reference to market activity
for highly liquid assets such as U.S. Treasury and agency
securities and agency residential mortgage-backed securities,
and matrix pricing for other asset classes, such as commercial
mortgage and other asset-backed securities. Another vendor
primarily uses pricing models considering adjustments for
ratings, spreads, matrix pricing and prepayments for the
instruments we value using this service, such as non-agency
residential mortgage-backed securities, agency adjustable rate
mortgage securities, agency collateralized mortgage
obligations (CMOs), commercial mortgage-backed securities
and municipal bonds. The vendors we use provide pricing
services on a global basis and have quality management
processes in place to monitor the integrity of the valuation
inputs and the prices provided to users, including procedures
to consider and incorporate information received from pricing
servicer users who may challenge a price. We monitor and
validate the reliability of vendor pricing on an ongoing basis
through periodic pricing methodology reviews, by performing
detailed reviews of the assumptions and inputs used by the
vendor to price individual securities, and through price
validation testing. Price validation testing is performed
independent of the risk-taking function and involves
corroborating the prices received from third-party vendors
with prices from another third-party source, by reviewing
valuations of comparable instruments, or by comparison to
internal valuations. Securities not priced by one of our pricing
vendors may be valued using a dealer quote. Dealer quotes
received are typically non-binding. Securities priced using a
dealer quote are subject to corroboration either with another
dealer quote, by comparison to similar securities priced by
another third-party source, or through internal valuation in
order to validate that the quote is representative of the market.
Security prices are also validated through actual cash
settlement upon sale of a security.
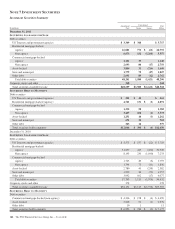
Securities are classified within the fair value hierarchy after
giving consideration to the nature and complexity of the
security, the activity level in the market for the security type,
and the observability of the inputs used to determine the fair
value. In circumstances where relevant market prices are
limited or unavailable, valuations may require significant
judgments or adjustments to determine fair value. In these
cases, the securities are classified as Level 3. As of
December 31, 2011 and 2010, securities classified as Level 3
consisted primarily of non-agency residential mortgage-
backed and asset-backed securities collateralized by first- and
second-lien residential mortgage loans. Fair value for these
securities is estimated primarily using pricing obtained from
third-party vendors. In some cases, fair value is estimated
using a dealer quote or by reference to prices of securities of a
similar vintage and collateral type. Market activity for these
security types is limited with little price transparency. As a
result, these securities are generally valued by the third-party
vendor using a discounted cash flow approach that
incorporates observable market activity where available.
Significant inputs to the valuation include prepayment
projections, credit loss assumptions, and discount rates that
are deemed representative of current market conditions.
A cross-functional team comprised of representatives from
Asset & Liability Management, Finance, and Market Risk
Management oversees the governance of the processes and
methodologies used to estimate the fair value of securities and
the price validation testing that is performed. Management
meets on a regular basis to review pricing sources and trends
and the results of validation testing.
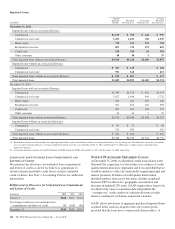
Financial Derivatives
Exchange-traded derivatives are valued using quoted market
prices and are classified as Level 1. However, the majority of
derivatives that we enter into are executed over-the-counter
and are valued using internal models. Readily observable
market inputs to these models can be validated to external
sources, including industry pricing services, or corroborated
through recent trades, dealer quotes, yield curves, implied
volatility or other market-related data. Certain derivatives,
such as total rate of return swaps, are corroborated to the
CMBX index. These derivatives are classified as Level 2.
Derivatives priced using significant management judgment or
assumptions are classified as Level 3.
The fair values of our derivatives are adjusted for
nonperformance risk including credit risk as appropriate. Our
nonperformance risk adjustment is computed using new loan
pricing and considers externally available bond spreads, in
conjunction with internal historical recovery observations.
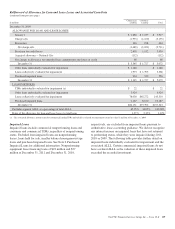
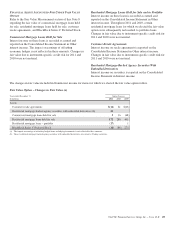
Residential Mortgage Loans Held for Sale
We have elected to account for certain residential mortgage
loans originated for sale on a recurring basis at fair value.
Residential mortgage loans are valued based on quoted market
prices, where available, prices for other traded mortgage loans
with similar characteristics, and purchase commitments and
bid information received from market participants. These
loans are regularly traded in active markets and observable
pricing information is available from market participants. The
prices are adjusted as necessary to include the embedded
servicing value in the loans and to take into consideration the
specific characteristics of certain loans that are priced based
The PNC Financial Services Group, Inc. – Form 10-K 149