PNC Bank 2011 Annual Report Download - page 159
Download and view the complete annual report
Please find page 159 of the 2011 PNC Bank annual report below. You can navigate through the pages in the report by either clicking on the pages listed below, or by using the keyword search tool below to find specific information within the annual report.-
 1
1 -
2
-
3
-
4
-
5
-
6
-
7
-
8
-
9
-
10
-
11
-
12
-
13
-
14
-
15
-
16
-
17
-
18
-
19
-
20
-
21
-
22
-
23
-
24
-
25
-
26
-
27
-
28
-
29
-
30
-
31
-
32
-
33
-
34
-
35
-
36
-
37
-
38
-
39
-
40
-
41
-
42
-
43
-
44
-
45
-
46
-
47
-
48
-
49
-
50
-
51
-
52
-
53
-
54
-
55
-
56
-
57
-
58
-
59
-
60
-
61
-
62
-
63
-
64
-
65
-
66
-
67
-
68
-
69
-
70
-
71
-
72
-
73
-
74
-
75
-
76
-
77
-
78
-
79
-
80
-
81
-
82
-
83
-
84
-
85
-
86
-
87
-
88
-
89
-
90
-
91
-
92
-
93
-
94
-
95
-
96
-
97
-
98
-
99
-
100
-
101
-
102
-
103
-
104
-
105
-
106
-
107
-
108
-
109
-
110
-
111
-
112
-
113
-
114
-
115
-
116
-
117
-
118
-
119
-
120
-
121
-
122
-
123
-
124
-
125
-
126
-
127
-
128
-
129
-
130
-
131
-
132
-
133
-
134
-
135
-
136
-
137
-
138
-
139
-
140
-
141
-
142
-
143
-
144
-
145
-
146
-
147
-
148
-
 149
149 -
 150
150 -
 151
151 -
 152
152 -
 153
153 -
 154
154 -
 155
155 -
 156
156 -
 157
157 -
 158
158 -
 159
159 -
 160
160 -
 161
161 -
 162
162 -
 163
163 -
 164
164 -
 165
165 -
 166
166 -
 167
167 -
 168
168 -
 169
169 -
170
-
171
-
172
-
173
-
174
-
175
-
176
-
177
-
178
-
179
-
180
-
181
-
182
-
183
-
184
-
185
-
186
-
187
-
188
-
189
-
190
-
191
-
192
-
193
-
194
-
195
-
196
-
197
-
198
-
199
-
200
-
201
-
202
-
203
-
204
-
205
-
206
-
207
-
208
-
209
-
210
-
211
-
212
-
213
-
214
-
215
-
216
-
217
-
218
-
219
-
220
-
221
-
222
-
223
-
224
-
225
-
226
-
227
-
228
-
229
-
230
-
231
-
232
-
233
-
234
-
235
-
236
-
237
-
238
 |
 |
on the pricing of similar loans. These adjustments represent
unobservable inputs to the valuation but are not considered
significant to the fair value of the loans. Accordingly,
residential mortgage loans held for sale are classified as
Level 2.
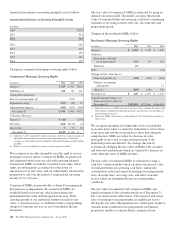
Residential Mortgage Servicing Rights
Residential mortgage servicing rights (MSRs) are carried at
fair value on a recurring basis. Assumptions incorporated into
the residential MSRs valuation model reflect management’s
best estimate of factors that a market participant would use in
valuing the residential MSRs. Although sales of residential
MSRs do occur, residential MSRs do not trade in an active,
open market with readily observable prices so the precise
terms and conditions of sales are not available. As a
benchmark for the reasonableness of its residential MSRs fair
value, PNC obtains opinions of value from independent
parties (“brokers”). These brokers provided a range (+/- 10
bps) based upon their own discounted cash flow calculations
of our portfolio that reflected conditions in the secondary
market, and any recently executed servicing transactions. PNC
compares its internally-developed residential MSRs value to
the ranges of values received from the brokers. If our
residential MSRs fair value falls outside of the brokers’
ranges, management will assess whether a valuation
adjustment is warranted. For 2011 and 2010, PNC’s
residential MSRs value has not fallen outside of the brokers’
ranges. We consider our residential MSRs value to represent a
reasonable estimate of fair value. Due to the nature of the
valuation inputs, residential MSRs are classified as Level 3.
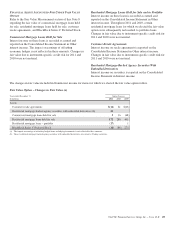
Commercial Mortgage Loans Held for Sale
We account for certain commercial mortgage loans classified
as held for sale at fair value. The election of the fair value
option aligns the accounting for the commercial mortgages
with the related hedges.
We determine the fair value of commercial mortgage loans
held for sale by using a whole loan methodology. Fair value is
determined using sale valuation assumptions that management
believes a market participant would use in pricing the loans.
When available, valuation assumptions included observable
inputs based on whole loan sales. Adjustments are made to
these assumptions to account for situations when uncertainties
exist, including market conditions and liquidity. Credit risk is
included as part of our valuation process for these loans by
considering expected rates of return for market participants for
similar loans in the marketplace. Based on the significance of
unobservable inputs, we classified this portfolio as Level 3.
Equity Investments
The valuation of direct and indirect private equity investments
requires significant management judgment due to the absence
of quoted market prices, inherent lack of liquidity and the
long-term nature of such investments. The carrying values of
direct and affiliated partnership interests reflect the expected
exit price and are based on various techniques including
multiples of adjusted earnings of the entity, independent
appraisals, anticipated financing and sale transactions with
third parties, or the pricing used to value the entity in a recent
financing transaction. We value indirect investments in private
equity funds based on net asset value as provided in the
financial statements that we receive from their managers. Due
to the time lag in our receipt of the financial information and
based on a review of investments and valuation techniques
applied, adjustments to the manager-provided value are made
when available recent portfolio company information or
market information indicates a significant change in value
from that provided by the manager of the fund. These
investments are classified as Level 3.
Customer Resale Agreements
We have elected to account for resale agreements, which are
economically hedged using free-standing financial derivatives,
at fair value. The fair value for resale agreements is
determined using a model that includes observable market
data such as interest rates as inputs. Readily observable
market inputs to this model can be validated to external
sources, including yield curves, implied volatility or other
market-related data. These instruments are classified as Level
2.
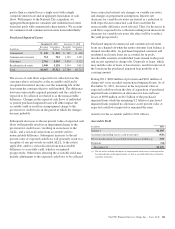
BlackRock Series C Preferred Stock
We have elected to account for the shares of BlackRock Series
C Preferred Stock received in a stock exchange with
BlackRock at fair value. We own approximately 1.5 million of
these shares after delivery of approximately 1.3 million shares
in September 2011 pursuant to our obligation to partially fund
a portion of certain BlackRock LTIP programs. The Series C
Preferred Stock economically hedges the BlackRock LTIP
liability that is accounted for as a derivative. The fair value of
the Series C Preferred Stock is determined using a third-party
modeling approach, which includes both observable and
unobservable inputs. This approach considers expectations of
a default/liquidation event and the use of liquidity discounts
based on our inability to sell the security at a fair, open market
price in a timely manner. Although dividends are equal to
common shares and other preferred series, significant transfer
restrictions exist on our Series C shares for any purpose other
than to satisfy the LTIP obligation. Due to the significance of
unobservable inputs, this security is classified as Level 3.
150 The PNC Financial Services Group, Inc. – Form 10-K