PNC Bank 2011 Annual Report Download - page 210
Download and view the complete annual report
Please find page 210 of the 2011 PNC Bank annual report below. You can navigate through the pages in the report by either clicking on the pages listed below, or by using the keyword search tool below to find specific information within the annual report.-
 1
1 -
2
-
3
-
4
-
5
-
6
-
7
-
8
-
9
-
10
-
11
-
12
-
13
-
14
-
15
-
16
-
17
-
18
-
19
-
20
-
21
-
22
-
23
-
24
-
25
-
26
-
27
-
28
-
29
-
30
-
31
-
32
-
33
-
34
-
35
-
36
-
37
-
38
-
39
-
40
-
41
-
42
-
43
-
44
-
45
-
46
-
47
-
48
-
49
-
50
-
51
-
52
-
53
-
54
-
55
-
56
-
57
-
58
-
59
-
60
-
61
-
62
-
63
-
64
-
65
-
66
-
67
-
68
-
69
-
70
-
71
-
72
-
73
-
74
-
75
-
76
-
77
-
78
-
79
-
80
-
81
-
82
-
83
-
84
-
85
-
86
-
87
-
88
-
89
-
90
-
91
-
92
-
93
-
94
-
95
-
96
-
97
-
98
-
99
-
100
-
101
-
102
-
103
-
104
-
105
-
106
-
107
-
108
-
109
-
110
-
111
-
112
-
113
-
114
-
115
-
116
-
117
-
118
-
119
-
120
-
121
-
122
-
123
-
124
-
125
-
126
-
127
-
128
-
129
-
130
-
131
-
132
-
133
-
134
-
135
-
136
-
137
-
138
-
139
-
140
-
141
-
142
-
143
-
144
-
145
-
146
-
147
-
148
-
149
-
150
-
151
-
152
-
153
-
154
-
155
-
156
-
157
-
158
-
159
-
160
-
161
-
162
-
163
-
164
-
165
-
166
-
167
-
168
-
169
-
170
-
171
-
172
-
173
-
174
-
175
-
176
-
177
-
178
-
179
-
180
-
181
-
182
-
183
-
184
-
185
-
186
-
187
-
188
-
189
-
190
-
191
-
192
-
193
-
194
-
195
-
196
-
197
-
198
-
199
-
 200
200 -
 201
201 -
 202
202 -
 203
203 -
 204
204 -
 205
205 -
 206
206 -
 207
207 -
 208
208 -
 209
209 -
 210
210 -
 211
211 -
 212
212 -
 213
213 -
 214
214 -
 215
215 -
 216
216 -
 217
217 -
 218
218 -
 219
219 -
 220
220 -
221
-
222
-
223
-
224
-
225
-
226
-
227
-
228
-
229
-
230
-
231
-
232
-
233
-
234
-
235
-
236
-
237
-
238
 |
 |

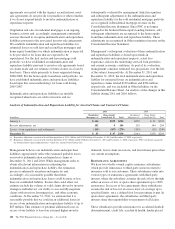
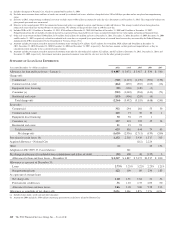
hazard, and borrower and lender paid mortgage insurance with
an aggregate maximum exposure up to the specified limits for
all reinsurance contracts as follows:
Reinsurance Agreements Exposure
In millions
December 31
2011
December 31
2010
Accidental Death & Dismemberment $2,255 $2,367
Credit Life, Accident & Health 951 1,003
Lender Placed Hazard (a) 2,899 709
Borrower and Lender Paid Mortgage
Insurance 327 463
Maximum Exposure $6,432 $4,542
Percentage of reinsurance agreements:
Excess of Loss – Mortgage Insurance 4% 8%
Quota Share 96% 92%
Maximum Exposure to Quota Share
Agreements with 100% Reinsurance $ 950 $1,001
(a) Transitioned to new Lender Placed Hazard reinsurance program in third quarter
2010 that lowered risk to PNC through the reduction in percentage of risk assumed
and the change from a stop loss feature to the purchase of catastrophe reinsurance.
As such, should a catastrophe event occur PNC will benefit from this reinsurance.
No credit for the catastrophe reinsurance protection is applied to the gross exposure
figure.
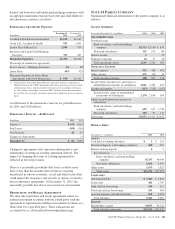
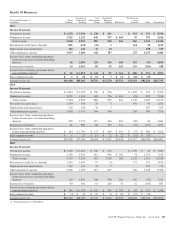
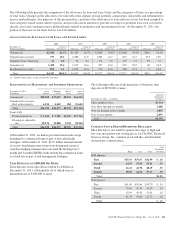
A rollforward of the reinsurance reserves for probable losses
for 2011 and 2010 follows:
Reinsurance Reserves – Rollforward
In millions 2011 2010
January 1 $ 150 $220
Paid Losses (109) (118)
Net Provision 41 51
Changes to Agreements (3)
December 31 $ 82 $150
Changes to agreements only represent entering into a new
relationship or exiting an existing agreement entirely. The
impact of changing the terms of existing agreements is
reflected in the net provision.
There is a reasonable possibility that losses could be more
than or less than the amount reserved due to on-going
uncertainty in various economic, social and other factors that
could impact the frequency and severity of claims covered by
these reinsurance agreements. At December 31, 2011, the
reasonably possible loss above our accrual was not material.
R
EPURCHASE AND
R
ESALE
A
GREEMENTS
We enter into repurchase and resale agreements where we
transfer investment securities to/from a third party with the
agreement to repurchase/resell those investment securities at a
future date for a specified price. These transactions are
accounted for as collateralized borrowings/financings.
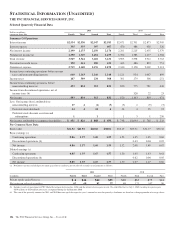
N
OTE
24 P
ARENT
C
OMPANY
Summarized financial information of the parent company is as
follows:
Income Statement
Year ended December 31 - in millions 2011 2010 2009
Operating Revenue
Dividends from:
Bank subsidiaries and bank holding
company $2,513 $2,180 $ 839
Non-bank subsidiaries 131 575 84
Interest income 112
Noninterest income 24 27 28
Total operating revenue 2,669 2,782 963
O
PERATING
E
XPENSE
Interest expense 333 458 495
Other expense 275 (61) 21
Total operating expense 608 397 516
Income before income taxes and equity in
undistributed net income of subsidiaries 2,061 2,385 447
Income tax benefits (113) (253) (147)
Income before equity in undistributed
net income of subsidiaries 2,174 2,638 594
Equity in undistributed net income of
subsidiaries:
Bank subsidiaries and bank holding
company 699 677 1,736
Non-bank subsidiaries 183 97 117
Net income $3,056 $3,412 $2,447
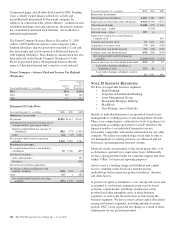
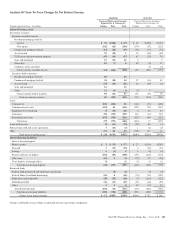
Balance Sheet
December 31 - in millions 2011 2010
A
SSETS
Cash held at banking subsidiary $2$ 151
Restricted deposits with banking subsidiary 400 250
Interest-earning deposits 65
Investments in:
Bank subsidiaries and bank holding
company 35,355 34,049
Non-bank subsidiaries 2,036 1,951
Other assets 1,675 1,523
Total assets $39,474 $37,929
L
IABILITIES
Subordinated debt $ 3,303 $ 3,804
Senior debt 381 1,799
Bank affiliate borrowings 144 112
Non-bank affiliate borrowings 631 964
Accrued expenses and other liabilities 962 1,008
Total liabilities 5,421 7,687
E
QUITY
Shareholder’s equity 34,053 30,242
Total liabilities and equity $39,474 $37,929
The PNC Financial Services Group, Inc. – Form 10-K 201