PNC Bank 2011 Annual Report Download - page 43
Download and view the complete annual report
Please find page 43 of the 2011 PNC Bank annual report below. You can navigate through the pages in the report by either clicking on the pages listed below, or by using the keyword search tool below to find specific information within the annual report.-
 1
1 -
2
-
3
-
4
-
5
-
6
-
7
-
8
-
9
-
10
-
11
-
12
-
13
-
14
-
15
-
16
-
17
-
18
-
19
-
20
-
21
-
22
-
23
-
24
-
25
-
26
-
27
-
28
-
29
-
30
-
31
-
32
-
 33
33 -
 34
34 -
 35
35 -
 36
36 -
 37
37 -
 38
38 -
 39
39 -
 40
40 -
 41
41 -
 42
42 -
 43
43 -
 44
44 -
 45
45 -
 46
46 -
 47
47 -
 48
48 -
 49
49 -
 50
50 -
 51
51 -
 52
52 -
 53
53 -
54
-
55
-
56
-
57
-
58
-
59
-
60
-
61
-
62
-
63
-
64
-
65
-
66
-
67
-
68
-
69
-
70
-
71
-
72
-
73
-
74
-
75
-
76
-
77
-
78
-
79
-
80
-
81
-
82
-
83
-
84
-
85
-
86
-
87
-
88
-
89
-
90
-
91
-
92
-
93
-
94
-
95
-
96
-
97
-
98
-
99
-
100
-
101
-
102
-
103
-
104
-
105
-
106
-
107
-
108
-
109
-
110
-
111
-
112
-
113
-
114
-
115
-
116
-
117
-
118
-
119
-
120
-
121
-
122
-
123
-
124
-
125
-
126
-
127
-
128
-
129
-
130
-
131
-
132
-
133
-
134
-
135
-
136
-
137
-
138
-
139
-
140
-
141
-
142
-
143
-
144
-
145
-
146
-
147
-
148
-
149
-
150
-
151
-
152
-
153
-
154
-
155
-
156
-
157
-
158
-
159
-
160
-
161
-
162
-
163
-
164
-
165
-
166
-
167
-
168
-
169
-
170
-
171
-
172
-
173
-
174
-
175
-
176
-
177
-
178
-
179
-
180
-
181
-
182
-
183
-
184
-
185
-
186
-
187
-
188
-
189
-
190
-
191
-
192
-
193
-
194
-
195
-
196
-
197
-
198
-
199
-
200
-
201
-
202
-
203
-
204
-
205
-
206
-
207
-
208
-
209
-
210
-
211
-
212
-
213
-
214
-
215
-
216
-
217
-
218
-
219
-
220
-
221
-
222
-
223
-
224
-
225
-
226
-
227
-
228
-
229
-
230
-
231
-
232
-
233
-
234
-
235
-
236
-
237
-
238
 |
 |

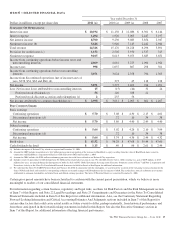
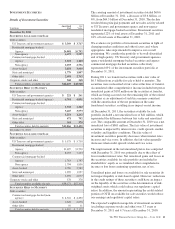
billion decrease in average total loans partially offset by a $1.7
billion increase in average total investment securities. The
overall decline in average loans reflected lower loan demand,
loan repayments, dispositions and net charge-offs. The
increase in total investment securities reflected net
investments of excess liquidity primarily in agency residential
mortgage-backed securities.
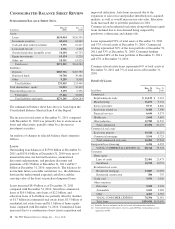
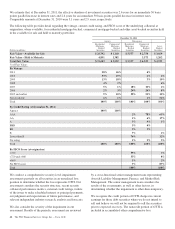
Total loans at December 31, 2011 increased $8.4 billion to
$159.0 billion compared with $150.6 billion at December 31,
2010. Average total loans decreased $1.8 billion or 1%, to
$152.0 billion, in 2011 compared with 2010 primarily as loan
growth during the second half of 2011 was offset by loan
decreases during the first half of 2011. The decrease in
average total loans primarily reflected declines in commercial
real estate of $3.7 billion and residential real estate of $2.8
billion, partially offset by a $5.1 billion increase in
commercial loans. Commercial real estate loans declined due
to loan sales, paydowns, and charge-offs. The decrease in
residential real estate was impacted by portfolio management
activities, paydowns and net charge-offs. Commercial loans
increased due to a combination of new client acquisition and
improved utilization. Loans represented 68% of average
interest-earning assets for 2011 and for 2010.
Average investment securities increased $1.7 billion, to $59.7
billion, in 2011 compared with 2010. Average securities held
to maturity increased $2.3 billion, to $9.4 billion, in 2011
compared with 2010. This increase was partially offset by the
decrease in average securities available for sale of $.6 billion,
to $50.3 billion, in 2011 compared with 2010. The increase in
average securities held to maturity was primarily a result of
transfers totalling $6.3 billion from securities available for
sale to securities held to maturity during the second and third
quarters of 2011.
Total investment securities comprised 27% of average
interest-earning assets for 2011 and 26% for 2010.
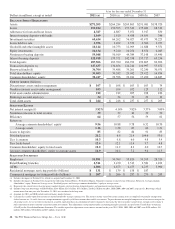
Average noninterest-earning assets totaled $41.0 billion in
2011 compared with $40.2 billion 2010.
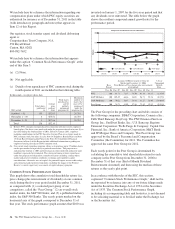
Average total deposits were $183.0 billion for 2011 compared
with $181.9 billion for 2010. Average deposits remained
essentially flat from the prior year period primarily as a result
of decreases of $8.9 billion in average retail certificates of
deposit, $.4 billion in average other time deposits, and $.4
billion in average time deposits in foreign offices, which were
offset by increases of $6.6 billion in average noninterest-
bearing deposits, $2.5 billion in average interest-bearing
demand deposits and $1.2 billion in average savings deposits.
Total deposits at December 31, 2011 were $188.0 billion
compared with $183.4 billion at December 31, 2010 and are
further discussed within the Consolidated Balance Sheet
Review section of this Report.
Average total deposits represented 69% of average total assets
for 2011 and 2010.
Average transaction deposits were $138.0 billion for 2011
compared with $128.4 billion for 2010. The continued
execution of the retail deposit strategy and customer
preference for liquidity contributed to the year-over-year
increase in average balances. In addition, commercial and
corporate deposit growth was very strong in 2011.
Average borrowed funds were $35.7 billion for 2011
compared with $40.2 billion for 2010. Maturities of Federal
Home Loan Bank (FHLB) borrowings drove the decline
compared to 2010. Total borrowed funds at December 31,
2011 were $36.7 billion compared with $39.5 billion at
December 31, 2010 and are further discussed within the
Consolidated Balance Sheet Review section of this Item 7. In
addition, the Liquidity Risk Management portion of the Risk
Management section of this Item 7 includes additional
information regarding our sources and uses of borrowed
funds.
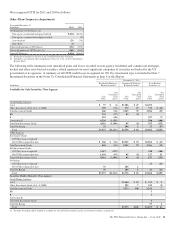
B
USINESS
S
EGMENT
H
IGHLIGHTS
Highlights of results for 2011 and 2010 are included below.
As a result of its sale, GIS is no longer a reportable business
segment.
We refer you to Item 1 of this Report under the captions
Business Overview and Review of Business Segments for an
overview of our business segments and to the Business
Segments Review section of this Item 7 for a Results Of
Businesses – Summary table and further analysis of business
segment results for 2011 and 2010, including presentation
differences from Note 25 Segment Reporting in the Notes To
Consolidated Financial Statements in Item 8 of this Report.
We provide a reconciliation of total business segment earnings
to PNC consolidated income from continuing operations
before noncontrolling interests as reported according to
accounting principles generally accepted in the United States
of America (GAAP) in Note 25 Segment Reporting in our
Notes To Consolidated Financial Statements of Item 8 of this
Report.
Retail Banking
Retail Banking earned $31 million for 2011 compared with
earnings of $144 million in 2010. Earnings declined from the
prior year as lower revenues from the impact of Regulation E
rules related to overdraft fees, a low interest rate environment,
and the regulatory impact of lower interchange fees on debit
card transactions, were partially offset by a lower provision
for credit losses and higher volumes of customer-initiated
transactions. Retail Banking continued to maintain its focus on
growing core customers, selectively investing in the business
for future growth, and disciplined expense management.
34 The PNC Financial Services Group, Inc. – Form 10-K