PNC Bank 2011 Annual Report Download - page 143
Download and view the complete annual report
Please find page 143 of the 2011 PNC Bank annual report below. You can navigate through the pages in the report by either clicking on the pages listed below, or by using the keyword search tool below to find specific information within the annual report.-
 1
1 -
2
-
3
-
4
-
5
-
6
-
7
-
8
-
9
-
10
-
11
-
12
-
13
-
14
-
15
-
16
-
17
-
18
-
19
-
20
-
21
-
22
-
23
-
24
-
25
-
26
-
27
-
28
-
29
-
30
-
31
-
32
-
33
-
34
-
35
-
36
-
37
-
38
-
39
-
40
-
41
-
42
-
43
-
44
-
45
-
46
-
47
-
48
-
49
-
50
-
51
-
52
-
53
-
54
-
55
-
56
-
57
-
58
-
59
-
60
-
61
-
62
-
63
-
64
-
65
-
66
-
67
-
68
-
69
-
70
-
71
-
72
-
73
-
74
-
75
-
76
-
77
-
78
-
79
-
80
-
81
-
82
-
83
-
84
-
85
-
86
-
87
-
88
-
89
-
90
-
91
-
92
-
93
-
94
-
95
-
96
-
97
-
98
-
99
-
100
-
101
-
102
-
103
-
104
-
105
-
106
-
107
-
108
-
109
-
110
-
111
-
112
-
113
-
114
-
115
-
116
-
117
-
118
-
119
-
120
-
121
-
122
-
123
-
124
-
125
-
126
-
127
-
128
-
129
-
130
-
131
-
132
-
 133
133 -
 134
134 -
 135
135 -
 136
136 -
 137
137 -
 138
138 -
 139
139 -
 140
140 -
 141
141 -
 142
142 -
 143
143 -
 144
144 -
 145
145 -
 146
146 -
 147
147 -
 148
148 -
 149
149 -
 150
150 -
 151
151 -
 152
152 -
 153
153 -
154
-
155
-
156
-
157
-
158
-
159
-
160
-
161
-
162
-
163
-
164
-
165
-
166
-
167
-
168
-
169
-
170
-
171
-
172
-
173
-
174
-
175
-
176
-
177
-
178
-
179
-
180
-
181
-
182
-
183
-
184
-
185
-
186
-
187
-
188
-
189
-
190
-
191
-
192
-
193
-
194
-
195
-
196
-
197
-
198
-
199
-
200
-
201
-
202
-
203
-
204
-
205
-
206
-
207
-
208
-
209
-
210
-
211
-
212
-
213
-
214
-
215
-
216
-
217
-
218
-
219
-
220
-
221
-
222
-
223
-
224
-
225
-
226
-
227
-
228
-
229
-
230
-
231
-
232
-
233
-
234
-
235
-
236
-
237
-
238
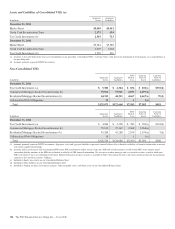
 |
 |

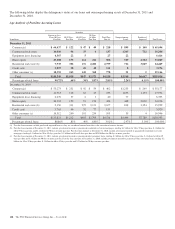
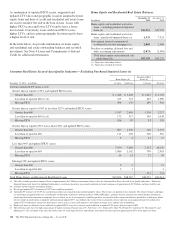
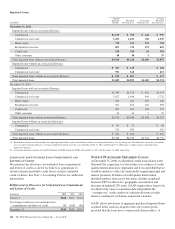
Consumer Real Estate Secured Asset Quality Indicators
Higher Risk Loans (a) All Other Loans
Home Equity and
Residential Real
Estate Loans
December 31, 2010 – dollars in millions Amount
% of Total
Loans Amount
% of Total
Loans
Recorded Investment
Amount
Home equity (b) $1,203 4% $33,023 96% $34,226
Residential real estate (c) 671 4% 15,328 96% 15,999
Total (d) $1,874 4% $48,351 96% $50,225
(a) At December 31, 2010, higher risk home equity loans are based upon updated FICO and original LTV while residential real estate higher risk loans are based upon updated FICO and
a combination of original and updated LTV. Higher risk loans exclude loans held for sale and government insured or guaranteed loans.
(b) We consider loans to be higher risk with an updated FICO of less than or equal to 660 and an original or updated LTV greater than or equal to 90%. The majority of the December 31,
2010 balance related to higher risk home equity loans is geographically distributed throughout the following areas: Pennsylvania 28%, Ohio 13%, New Jersey 11%, Illinois 7%,
Michigan 6%, and Kentucky 5%. All other states, none of which comprise more than 4%, make up the remainder of the balance.
(c) We consider loans to be higher risk with an updated FICO of less than or equal to 660 and an original or updated LTV greater than or equal to 90%. The majority of the December 31,
2010 balance related to higher risk residential real estate loans is geographically distributed throughout the following areas: California 23%, Florida 11%, Illinois 11%, and Maryland
8%. All other states, none of which comprise more than 5%, make up the remainder of the balance.
(d) Total loans include purchased impaired loans of $6.4 billion at December 31, 2010.
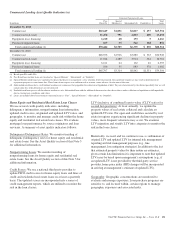
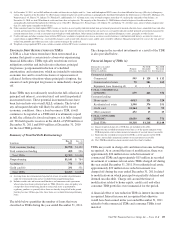
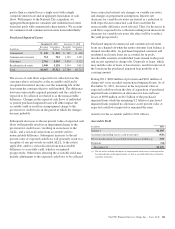
Credit Card and Other Consumer Loan Classes
We monitor a variety of asset quality information in the
management of the credit card and other consumer loan
classes. Other consumer loan classes include education,
automobile, and other secured and unsecured lines and loans.
Along with the trending of delinquencies and losses for each
class, FICO credit score updates are generally obtained on a
monthly basis, as well as a variety of credit bureau attributes.
Loans with high FICO scores tend to have a lower likelihood
of loss. Conversely, loans with low FICO scores tend to have
a higher likelihood of loss.
Consumer Purchased Impaired Loans Class
Estimates of the expected cash flows primarily determine the
credit impacts of consumer purchased impaired loans.
Consumer cash flow estimates are influenced by a number of
credit related items, which include, but are not limited to:
estimated real estate values, payment patterns, updated FICO
scores, the current economic environment, updated LTV ratios
and the date of origination. These key factors are monitored to
help ensure that concentrations of risk are mitigated and cash
flows are maximized.
See Note 6 Purchased Impaired Loans for additional information.
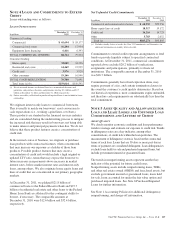
Credit Card and Other Consumer Loan Classes Asset Quality Indicators
Credit Card (a) Other Consumer (b)
Dollars in millions Amount
% of Total Loans
Using FICO
Credit Metric Amount
% of Total Loans
Using FICO
Credit Metric
December 31, 2011
FICO score greater than 719 $2,016 51% $ 5,556 61%
650 to 719 1,100 28 2,125 23
620 to 649 184 5 370 4
Less than 620 284 7 548 6
No FICO score available or required (c) 392 9 574 6
Total loans using FICO credit metric 3,976 100% 9,173 100%
Consumer loans using other internal credit metrics (b) 9,993
Total loan balance $3,976 $19,166
Weighted-average current FICO score (d) 723 739
December 31, 2010
FICO score greater than 719 $1,895 48% $ 4,135 58%
650 to 719 1,149 29 1,984 28
620 to 649 183 5 295 4
Less than 620 424 11 652 9
No FICO score available or required (c) 269 7 81 1
Total loans using FICO credit metric 3,920 100% 7,147 100%
Consumer loans using other internal credit metrics (b) 9,799
Total loan balance $3,920 $16,946
Weighted-average current FICO score (d) 709 713
134 The PNC Financial Services Group, Inc. – Form 10-K