PNC Bank 2011 Annual Report Download - page 80
Download and view the complete annual report
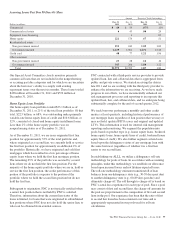
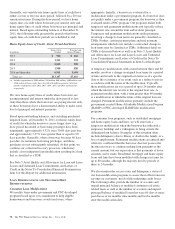
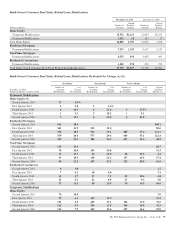
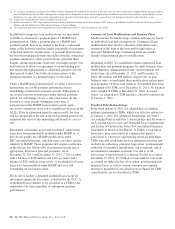
Please find page 80 of the 2011 PNC Bank annual report below. You can navigate through the pages in the report by either clicking on the pages listed below, or by using the keyword search tool below to find specific information within the annual report.During 2011 and 2010, unresolved and settled investor
indemnification and repurchase claims were primarily related to
one of the following alleged breaches in representations and
warranties: 1) misrepresentation of income, assets or
employment; 2) property evaluation or status issues (e.g.,
appraisal, title, etc.); 3) underwriting guideline violations; or 4)
mortgage insurance rescissions. During 2011, the volume of
residential mortgage indemnification and repurchase claims
increased reflecting the prolonged weak residential housing
sector and the continuing industry trend of Agency investors
pursuing strategies to aggressively reduce their exposure to
losses on purchased loans. This increase, along with an increase
in the average time to resolve investor claims, has contributed
to the higher balances of unresolved claims for residential
mortgages at December 31, 2011. The extended period of time
to resolve these investor claims coupled with higher claim
rescission rates drove the decline in residential mortgage
indemnification and repurchase settlement activity in 2011. As
the level of residential mortgage claims increased over the past
couple of years, management focused its efforts on improving
its process to review and respond to these claims. The lower
balance of unresolved indemnification and repurchase claims
for home equity loans/lines at December 31, 2011 was
primarily attributed to pooled settlement activity and higher
claim rescission rates during 2011. Management also
implemented enhancements to its process of reviewing and
responding to investor claims for this sold portfolio. The pooled
settlement activity also drove the year-over-year increase in
home equity indemnification and repurchase settlements. As a
result, certain investor indemnification and repurchase requests
received in 2010 were not resolved until the pooled settlement
activity occurred in 2011.
For the first and second-lien mortgage balances of unresolved
and settled claims contained in the tables above, a significant
amount of these claims were associated with sold loans
originated through correspondent lender and broker
origination channels. For the home equity loans/lines sold
portfolio, all unresolved and settled claims relate to loans
originated through the broker origination channel. In certain
instances when indemnification or repurchase claims are
settled for these types of sold loans, we have recourse back to
the correspondent lenders, brokers and other third-parties
(e.g., contract underwriting companies, closing agents,
appraisers, etc.). Depending on the underlying reason for the
investor claim, we determine our ability to pursue recourse
with these parties and file claims with them accordingly. Our
historical recourse recovery rate has been insignificant as our
efforts have been impacted by the inability of such parties to
reimburse us for their recourse obligations (e.g., their capital
availability or whether they remain in business) or contractual
limitations that limit our ability to pursue recourse with these
parties (e.g., loss caps, statutes of limitations, etc.). Broker
recourse activities, to the extent material, as well as the trends
in unresolved claim and indemnification and repurchase
activity described above are considered in the determination
of our estimated indemnification and repurchase liability
detailed below.
Origination and sale of residential mortgages is an ongoing
business activity and, accordingly, management continually
assesses the need to recognize indemnification and repurchase
liabilities pursuant to the associated investor sale agreements.
We establish indemnification and repurchase liabilities for
estimated losses on sold first and second-lien mortgages and
home equity loans/lines for which indemnification is expected
to be provided or for loans that are expected to be
repurchased. For the first and second-lien mortgage sold
portfolio, we have established an indemnification and
repurchase liability pursuant to investor sale agreements based
on claims made and our estimate of future claims on a loan by
loan basis. These relate primarily to loans originated during
2006-2008. For the home equity loans/lines sold portfolio, we
have established indemnification and repurchase liabilities
based upon this same methodology for loans sold during
2005-2007.
Indemnification and repurchase liabilities, which are included
in Other liabilities on the Consolidated Balance Sheet, are
initially recognized when loans are sold to investors and are
subsequently evaluated by management. Initial recognition
and subsequent adjustments to the indemnification and
repurchase liability for the sold residential mortgage portfolio
are recognized in Residential mortgage revenue on the
Consolidated Income Statement. Since PNC is no longer
engaged in the brokered home equity lending business, only
subsequent adjustments are recognized to the home equity
loans/lines indemnification and repurchase liability. These
adjustments are recognized in Other noninterest income on the
Consolidated Income Statement.
Management’s subsequent evaluation of these indemnification
and repurchase liabilities is based upon trends in
indemnification and repurchase requests, actual loss
experience, risks in the underlying serviced loan portfolios,
and current economic conditions. As part of its evaluation,
management considers estimated loss projections over the life
of the subject loan portfolio. We believe our indemnification
and repurchase liabilities appropriately reflect the estimated
probable losses on investor indemnification and repurchase
claims at December 31, 2011 and December 31, 2010.
At December 31, 2011 and December 31, 2010, the liability
for estimated losses on indemnification and repurchase claims
for residential mortgages totaled $83 million and $144
million, respectively. The year-over-year decline in this
liability reflects lower estimated losses driven primarily by the
seasoning of the sold portfolio and higher claim rescission
rates as described above. This decrease resulted despite higher
levels of investor indemnification and repurchase claim
activity. The indemnification and repurchase liability for
home equity loans/lines was $47 million and $150 million at
The PNC Financial Services Group, Inc. – Form 10-K 71


