PNC Bank 2011 Annual Report Download - page 188
Download and view the complete annual report
Please find page 188 of the 2011 PNC Bank annual report below. You can navigate through the pages in the report by either clicking on the pages listed below, or by using the keyword search tool below to find specific information within the annual report.-
 1
1 -
2
-
3
-
4
-
5
-
6
-
7
-
8
-
9
-
10
-
11
-
12
-
13
-
14
-
15
-
16
-
17
-
18
-
19
-
20
-
21
-
22
-
23
-
24
-
25
-
26
-
27
-
28
-
29
-
30
-
31
-
32
-
33
-
34
-
35
-
36
-
37
-
38
-
39
-
40
-
41
-
42
-
43
-
44
-
45
-
46
-
47
-
48
-
49
-
50
-
51
-
52
-
53
-
54
-
55
-
56
-
57
-
58
-
59
-
60
-
61
-
62
-
63
-
64
-
65
-
66
-
67
-
68
-
69
-
70
-
71
-
72
-
73
-
74
-
75
-
76
-
77
-
78
-
79
-
80
-
81
-
82
-
83
-
84
-
85
-
86
-
87
-
88
-
89
-
90
-
91
-
92
-
93
-
94
-
95
-
96
-
97
-
98
-
99
-
100
-
101
-
102
-
103
-
104
-
105
-
106
-
107
-
108
-
109
-
110
-
111
-
112
-
113
-
114
-
115
-
116
-
117
-
118
-
119
-
120
-
121
-
122
-
123
-
124
-
125
-
126
-
127
-
128
-
129
-
130
-
131
-
132
-
133
-
134
-
135
-
136
-
137
-
138
-
139
-
140
-
141
-
142
-
143
-
144
-
145
-
146
-
147
-
148
-
149
-
150
-
151
-
152
-
153
-
154
-
155
-
156
-
157
-
158
-
159
-
160
-
161
-
162
-
163
-
164
-
165
-
166
-
167
-
168
-
169
-
170
-
171
-
172
-
173
-
174
-
175
-
176
-
177
-
 178
178 -
 179
179 -
 180
180 -
 181
181 -
 182
182 -
 183
183 -
 184
184 -
 185
185 -
 186
186 -
 187
187 -
 188
188 -
 189
189 -
 190
190 -
 191
191 -
 192
192 -
 193
193 -
 194
194 -
 195
195 -
 196
196 -
 197
197 -
 198
198 -
199
-
200
-
201
-
202
-
203
-
204
-
205
-
206
-
207
-
208
-
209
-
210
-
211
-
212
-
213
-
214
-
215
-
216
-
217
-
218
-
219
-
220
-
221
-
222
-
223
-
224
-
225
-
226
-
227
-
228
-
229
-
230
-
231
-
232
-
233
-
234
-
235
-
236
-
237
-
238
 |
 |
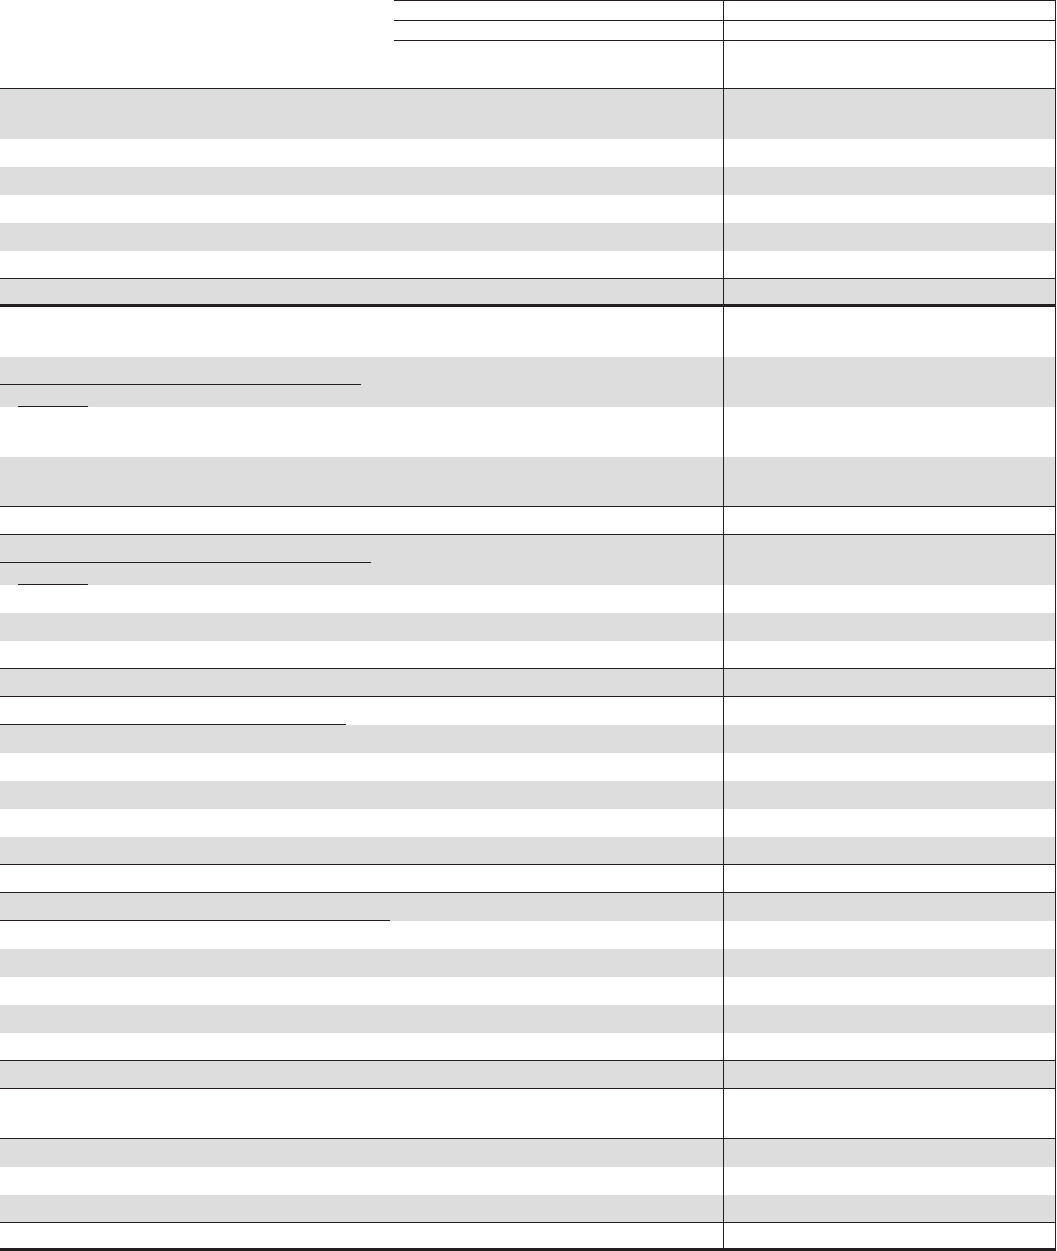
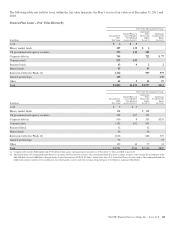
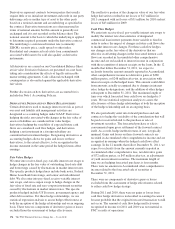
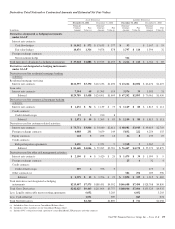
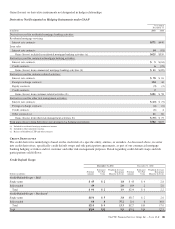
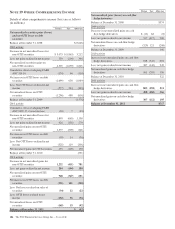
Derivatives Total Notional or Contractual Amounts and Estimated Net Fair Values
Asset Derivatives Liability Derivatives
December 31, 2011 December 31, 2010 December 31, 2011 December 31, 2010
In millions
Notional/
Contract
Amount
Fair
Value (a)
Notional/
Contract
Amount
Fair
Value (a)
Notional/
Contract
Amount
Fair
Value (b)
Notional/
Contract
Amount
Fair
Value (b)
Derivatives designated as hedging instruments
under GAAP
Interest rate contracts:
Cash flow hedges $ 16,542 $ 572 $ 13,635 $ 377 $93 $ 3,167 $ 53
Fair value hedges 10,476 1,316 9,878 878 1,797 $ 116 1,594 32
Foreign exchange contracts:
Net investment hedge 326
Total derivatives designated as hedging instruments $ 27,018 $1,888 $ 23,513 $1,255 $ 2,216 $ 116 $ 4,761 $ 85
Derivatives not designated as hedging instruments
under GAAP
Derivatives used for residential mortgage banking
activities:
Residential mortgage servicing
Interest rate contracts $122,395 $3,390 $112,236 $1,490 $ 63,226 $2,854 $ 66,476 $1,419
Loan sales
Interest rate contracts 7,394 68 11,765 119 3,976 39 3,585 31
Subtotal $129,789 $3,458 $124,001 $1,609 $ 67,202 $2,893 $ 70,061 $1,450
Derivatives used for commercial mortgage banking
activities:
Interest rate contracts $ 1,476 $ 54 $ 1,159 $ 75 $ 1,149 $ 80 $ 1,813 $ 111
Credit contracts:
Credit default swaps 95 5 210 8
Subtotal $ 1,571 $ 59 $ 1,369 $ 83 $ 1,149 $ 80 $ 1,813 $ 111
Derivatives used for customer-related activities:
Interest rate contracts $ 73,751 $3,804 $ 54,060 $2,611 $ 68,981 $3,943 $ 49,619 $2,703
Foreign exchange contracts 6,088 231 3,659 149 5,832 222 4,254 155
Equity contracts 118 5 195 16 66 8 139 19
Credit contracts:
Risk participation agreements 1,691 6 1,371 5 1,568 5 1,367 2
Subtotal $ 81,648 $4,046 $ 59,285 $2,781 $ 76,447 $4,178 $ 55,379 $2,879
Derivatives used for other risk management activities:
Interest rate contracts $ 2,190 $ 6 $ 3,420 $ 20 $ 1,479 $ 39 $ 1,099 $ 9
Foreign exchange contracts 25 4 32 4
Credit contracts:
Credit default swaps 209 6 376 9 175 1
Other contracts (c) 386 296 209 396
Subtotal $ 2,399 $ 12 $ 3,796 $ 29 $ 1,890 $ 339 $ 1,515 $ 410
Total derivatives not designated as hedging
instruments $215,407 $7,575 $188,451 $4,502 $146,688 $7,490 $128,768 $4,850
Total Gross Derivatives $242,425 $9,463 $211,964 $5,757 $148,904 $7,606 $133,529 $4,935
Less: Legally enforceable master netting agreements 6,052 3,203 6,052 3,203
Less: Cash collateral 1,051 659 843 674
Total Net Derivatives $2,360 $1,895 $ 711 $1,058
(a) Included in Other Assets on our Consolidated Balance Sheet.
(b) Included in Other Liabilities on our Consolidated Balance Sheet.
(c) Includes PNC’s obligation to fund a portion of certain BlackRock LTIP programs and other contracts.
The PNC Financial Services Group, Inc. – Form 10-K 179