PNC Bank 2011 Annual Report Download - page 68
Download and view the complete annual report
Please find page 68 of the 2011 PNC Bank annual report below. You can navigate through the pages in the report by either clicking on the pages listed below, or by using the keyword search tool below to find specific information within the annual report.-
 1
1 -
2
-
3
-
4
-
5
-
6
-
7
-
8
-
9
-
10
-
11
-
12
-
13
-
14
-
15
-
16
-
17
-
18
-
19
-
20
-
21
-
22
-
23
-
24
-
25
-
26
-
27
-
28
-
29
-
30
-
31
-
32
-
33
-
34
-
35
-
36
-
37
-
38
-
39
-
40
-
41
-
42
-
43
-
44
-
45
-
46
-
47
-
48
-
49
-
50
-
51
-
52
-
53
-
54
-
55
-
56
-
57
-
 58
58 -
 59
59 -
 60
60 -
 61
61 -
 62
62 -
 63
63 -
 64
64 -
 65
65 -
 66
66 -
 67
67 -
 68
68 -
 69
69 -
 70
70 -
 71
71 -
 72
72 -
 73
73 -
 74
74 -
 75
75 -
 76
76 -
 77
77 -
 78
78 -
79
-
80
-
81
-
82
-
83
-
84
-
85
-
86
-
87
-
88
-
89
-
90
-
91
-
92
-
93
-
94
-
95
-
96
-
97
-
98
-
99
-
100
-
101
-
102
-
103
-
104
-
105
-
106
-
107
-
108
-
109
-
110
-
111
-
112
-
113
-
114
-
115
-
116
-
117
-
118
-
119
-
120
-
121
-
122
-
123
-
124
-
125
-
126
-
127
-
128
-
129
-
130
-
131
-
132
-
133
-
134
-
135
-
136
-
137
-
138
-
139
-
140
-
141
-
142
-
143
-
144
-
145
-
146
-
147
-
148
-
149
-
150
-
151
-
152
-
153
-
154
-
155
-
156
-
157
-
158
-
159
-
160
-
161
-
162
-
163
-
164
-
165
-
166
-
167
-
168
-
169
-
170
-
171
-
172
-
173
-
174
-
175
-
176
-
177
-
178
-
179
-
180
-
181
-
182
-
183
-
184
-
185
-
186
-
187
-
188
-
189
-
190
-
191
-
192
-
193
-
194
-
195
-
196
-
197
-
198
-
199
-
200
-
201
-
202
-
203
-
204
-
205
-
206
-
207
-
208
-
209
-
210
-
211
-
212
-
213
-
214
-
215
-
216
-
217
-
218
-
219
-
220
-
221
-
222
-
223
-
224
-
225
-
226
-
227
-
228
-
229
-
230
-
231
-
232
-
233
-
234
-
235
-
236
-
237
-
238
 |
 |

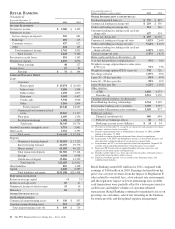
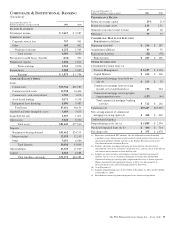
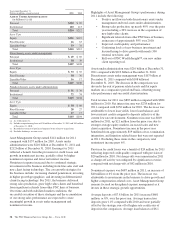
billion decreased $194 million, or 3%, from the prior year
primarily due to credit risk management activities within the
portfolio offsetting new client acquisition.
R
ESIDENTIAL
M
ORTGAGE
B
ANKING
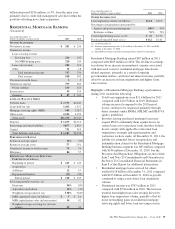
(Unaudited)
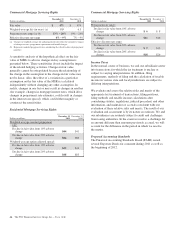
Year ended December 31
Dollars in millions, except as noted 2011 2010
I
NCOME
S
TATEMENT
Net interest income $ 201 $ 256
Noninterest income
Loan servicing revenue
Servicing fees 226 242
Net MSR hedging gains 220 245
Loan sales revenue 282 231
Other 19 18
Total noninterest income 747 736
Total revenue 948 992
Provision for credit losses 55
Noninterest expense 797 563
Pretax earnings 146 424
Income taxes 59 155
Earnings $87$ 269
A
VERAGE
B
ALANCE
S
HEET
Portfolio loans $ 2,771 $2,649
Loans held for sale 1,492 1,322
Mortgage servicing rights (MSR) 905 1,017
Other assets 6,102 4,259
Total assets $11,270 $9,247
Deposits $ 1,675 $2,716
Borrowings and other liabilities 3,877 2,823
Capital 731 919
Total liabilities and equity $ 6,283 $6,458
P
ERFORMANCE
R
ATIOS
Return on average capital 12% 29%
Return on average assets .77 2.91
Noninterest income to total revenue 79 74
Efficiency 84 57
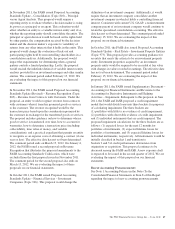
R
ESIDENTIAL
M
ORTGAGE
S
ERVICING
P
ORTFOLIO
(in billions)
Beginning of period $ 125 $ 145
Acquisitions 6
Additions 12 10
Repayments/transfers (25) (30)
End of period $ 118 $ 125
Servicing portfolio statistics: (a)
Fixed rate 90% 89%
Adjustable rate/balloon 10% 11%
Weighted-average interest rate 5.38% 5.62%
MSR capitalized value (in billions) $.7$ 1.0
MSR capitalization value (in basis points) 54 82
Weighted-average servicing fee (in basis
points) 29 30
Year ended December 31
Dollars in millions, except as noted 2011 2010
O
THER
I
NFORMATION
Loan origination volume (in billions) $11.4 $10.5
Percentage of originations represented by:
Agency and government programs 100% 99%
Refinance volume 76% 74%
Total nonperforming assets (a) (b) $76 $ 172
Purchased impaired loans (a) (c) $ 112 $ 161
(a) As of December 31.
(b) Includes nonperforming loans of $31 million at December 31, 2011 and $109
million at December 31, 2010.
(c) Recorded investment of purchased impaired loans related to acquisitions.
Residential Mortgage Banking earned $87 million in 2011
compared with $269 million in 2010. The decline in earnings
was driven by an increase in noninterest expense associated
with increased costs for residential mortgage foreclosure-
related expenses, primarily as a result of ongoing
governmental matters, and lower net interest income, partially
offset by an increase in loan originations and higher loans
sales revenue.
Highlights of Residential Mortgage Banking’s performance
during 2011 include the following:
• Total loan originations were $11.4 billion for 2011
compared with $10.5 billion in 2010. Refinance
volume increased compared to the 2010 period.
Loans continue to be originated primarily through
direct channels under FNMA, FHLMC and FHA/VA
agency guidelines.
• Investors having purchased mortgage loans may
request PNC to indemnify them against losses on
certain loans or to repurchase loans that they believe
do not comply with applicable contractual loan
origination covenants and representations and
warranties we have made. At December 31, 2011, the
liability for estimated losses on repurchase and
indemnification claims for the Residential Mortgage
Banking business segment was $83 million compared
with $144 million at December 31, 2010. See the
Recourse And Repurchase Obligations section of this
Item 7 and Note 23 Commitments and Guarantees in
the Notes To Consolidated Financial Statements in
Item 8 of this Report for additional information.
• Residential mortgage loans serviced for others
totalled $118 billion at December 31, 2011 compared
with $125 billion at December 31, 2010 as payoffs
continued to outpace new direct loan origination
volume.
• Noninterest income was $747 million in 2011
compared with $736 million in 2010. The increase
resulted from higher loan sales revenue driven by
higher loan origination volume, partially offset by
lower net hedging gains on residential mortgage
servicing rights and lower loan servicing revenue.
The PNC Financial Services Group, Inc. – Form 10-K 59