PNC Bank 2011 Annual Report Download - page 163
Download and view the complete annual report
Please find page 163 of the 2011 PNC Bank annual report below. You can navigate through the pages in the report by either clicking on the pages listed below, or by using the keyword search tool below to find specific information within the annual report.-
 1
1 -
2
-
3
-
4
-
5
-
6
-
7
-
8
-
9
-
10
-
11
-
12
-
13
-
14
-
15
-
16
-
17
-
18
-
19
-
20
-
21
-
22
-
23
-
24
-
25
-
26
-
27
-
28
-
29
-
30
-
31
-
32
-
33
-
34
-
35
-
36
-
37
-
38
-
39
-
40
-
41
-
42
-
43
-
44
-
45
-
46
-
47
-
48
-
49
-
50
-
51
-
52
-
53
-
54
-
55
-
56
-
57
-
58
-
59
-
60
-
61
-
62
-
63
-
64
-
65
-
66
-
67
-
68
-
69
-
70
-
71
-
72
-
73
-
74
-
75
-
76
-
77
-
78
-
79
-
80
-
81
-
82
-
83
-
84
-
85
-
86
-
87
-
88
-
89
-
90
-
91
-
92
-
93
-
94
-
95
-
96
-
97
-
98
-
99
-
100
-
101
-
102
-
103
-
104
-
105
-
106
-
107
-
108
-
109
-
110
-
111
-
112
-
113
-
114
-
115
-
116
-
117
-
118
-
119
-
120
-
121
-
122
-
123
-
124
-
125
-
126
-
127
-
128
-
129
-
130
-
131
-
132
-
133
-
134
-
135
-
136
-
137
-
138
-
139
-
140
-
141
-
142
-
143
-
144
-
145
-
146
-
147
-
148
-
149
-
150
-
151
-
152
-
 153
153 -
 154
154 -
 155
155 -
 156
156 -
 157
157 -
 158
158 -
 159
159 -
 160
160 -
 161
161 -
 162
162 -
 163
163 -
 164
164 -
 165
165 -
 166
166 -
 167
167 -
 168
168 -
 169
169 -
 170
170 -
 171
171 -
 172
172 -
 173
173 -
174
-
175
-
176
-
177
-
178
-
179
-
180
-
181
-
182
-
183
-
184
-
185
-
186
-
187
-
188
-
189
-
190
-
191
-
192
-
193
-
194
-
195
-
196
-
197
-
198
-
199
-
200
-
201
-
202
-
203
-
204
-
205
-
206
-
207
-
208
-
209
-
210
-
211
-
212
-
213
-
214
-
215
-
216
-
217
-
218
-
219
-
220
-
221
-
222
-
223
-
224
-
225
-
226
-
227
-
228
-
229
-
230
-
231
-
232
-
233
-
234
-
235
-
236
-
237
-
238
 |
 |
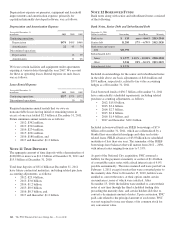
appraisals are regularly reviewed. We have a real estate
valuation services group whose sole function is to manage the
real estate appraisal solicitation and evaluation process for
commercial loans. All third-party appraisals are reviewed by
this group, including consideration of comments/questions on
the appraisal by the reviewer, customer relationship manager,
credit officer, and underwriter. Upon resolving these
comments/questions through discussions with the third-party
appraiser, adjustments to the initial appraisal may occur and
be incorporated into the final issued appraisal report.
For loans secured by commercial properties where the
underlying collateral is $250,000 and less, there is no
requirement to obtain an appraisal. In instances where an
appraisal is not obtained, the collateral value is determined
consistent with external third-party appraisal standards, by an
internal person independent of the lending customer
relationship/loan production process. If an appraisal is
outdated due to changed project or market conditions, or if the
net book value is utilized, management uses a Loss Given
Default (LGD) percentage which represents the exposure PNC
expects to lose in the event a borrower defaults on an
obligation. Accordingly, LGD is a function of collateral
recovery rates and loan-to-value. Collateral recovery rates
vary based upon collateral type and represent the expected
recovery amount on defaulted loans from the collateral after
workout costs. Those rates are established based upon actual
PNC loss experience and external market data.
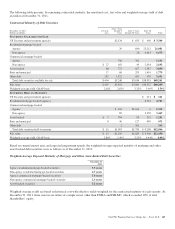
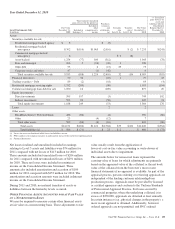
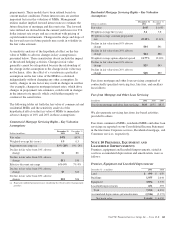
The amounts below for loans held for sale represent the
carrying value of loans for which adjustments are primarily
based on observable market data, management’s internal
assumptions or the appraised value of collateral. The fair
value determination of the equity investment resulting in an
impairment loss included below was based on observable
market data for other comparable entities as adjusted for
internal assumptions and unobservable inputs. The amounts
below for commercial mortgage servicing rights reflect an
impairment of three strata at both December 31, 2011 and
December 31, 2010, respectively. The fair value of
commercial mortgage servicing rights is estimated by using an
internal valuation model. The model calculates the present
value of estimated future net servicing cash flows considering
estimates of servicing revenue and costs, discount rates and
prepayment speeds. The amounts below for OREO and
foreclosed assets are primarily based on appraised values or
sales price less costs to sell. The amounts below for long-lived
assets held for sale represent the carrying value of the asset
(lower of recorded net book value or sales price less estimated
cost to sell) based upon a recent appraisal, a recent sales offer,
or management assumptions which take into consideration
changes in the market environment or changes in property
conditions.
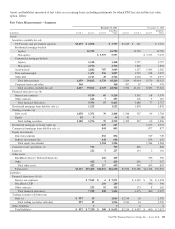
Fair Value Measurements – Nonrecurring (a)
Fair Value
Gains (Losses)
Year ended
In millions
December 31
2011
December 31
2010
December 31
2011
December 31
2010
Assets
Nonaccrual loans $ 253 $ 429 $ (49) $81
Loans held for sale 130 350 (2) (93)
Equity investments 13(2) (3)
Commercial mortgage servicing rights 457 644 (157) (40)
Other intangible assets 1
OREO and foreclosed assets 223 245 (71) (103)
Long-lived assets held for sale 17 25 (5) (30)
Total assets $1,081 $1,697 $(286) $(188)
(a) All Level 3.
154 The PNC Financial Services Group, Inc. – Form 10-K