PNC Bank 2011 Annual Report Download - page 190
Download and view the complete annual report
Please find page 190 of the 2011 PNC Bank annual report below. You can navigate through the pages in the report by either clicking on the pages listed below, or by using the keyword search tool below to find specific information within the annual report.-
 1
1 -
2
-
3
-
4
-
5
-
6
-
7
-
8
-
9
-
10
-
11
-
12
-
13
-
14
-
15
-
16
-
17
-
18
-
19
-
20
-
21
-
22
-
23
-
24
-
25
-
26
-
27
-
28
-
29
-
30
-
31
-
32
-
33
-
34
-
35
-
36
-
37
-
38
-
39
-
40
-
41
-
42
-
43
-
44
-
45
-
46
-
47
-
48
-
49
-
50
-
51
-
52
-
53
-
54
-
55
-
56
-
57
-
58
-
59
-
60
-
61
-
62
-
63
-
64
-
65
-
66
-
67
-
68
-
69
-
70
-
71
-
72
-
73
-
74
-
75
-
76
-
77
-
78
-
79
-
80
-
81
-
82
-
83
-
84
-
85
-
86
-
87
-
88
-
89
-
90
-
91
-
92
-
93
-
94
-
95
-
96
-
97
-
98
-
99
-
100
-
101
-
102
-
103
-
104
-
105
-
106
-
107
-
108
-
109
-
110
-
111
-
112
-
113
-
114
-
115
-
116
-
117
-
118
-
119
-
120
-
121
-
122
-
123
-
124
-
125
-
126
-
127
-
128
-
129
-
130
-
131
-
132
-
133
-
134
-
135
-
136
-
137
-
138
-
139
-
140
-
141
-
142
-
143
-
144
-
145
-
146
-
147
-
148
-
149
-
150
-
151
-
152
-
153
-
154
-
155
-
156
-
157
-
158
-
159
-
160
-
161
-
162
-
163
-
164
-
165
-
166
-
167
-
168
-
169
-
170
-
171
-
172
-
173
-
174
-
175
-
176
-
177
-
178
-
179
-
 180
180 -
 181
181 -
 182
182 -
 183
183 -
 184
184 -
 185
185 -
 186
186 -
 187
187 -
 188
188 -
 189
189 -
 190
190 -
 191
191 -
 192
192 -
 193
193 -
 194
194 -
 195
195 -
 196
196 -
 197
197 -
 198
198 -
 199
199 -
 200
200 -
201
-
202
-
203
-
204
-
205
-
206
-
207
-
208
-
209
-
210
-
211
-
212
-
213
-
214
-
215
-
216
-
217
-
218
-
219
-
220
-
221
-
222
-
223
-
224
-
225
-
226
-
227
-
228
-
229
-
230
-
231
-
232
-
233
-
234
-
235
-
236
-
237
-
238
 |
 |

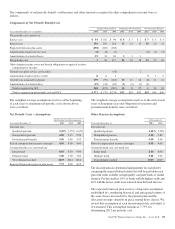
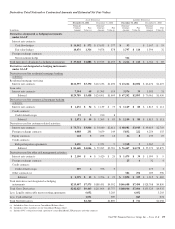
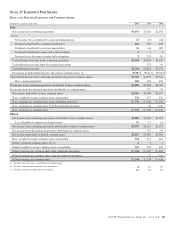
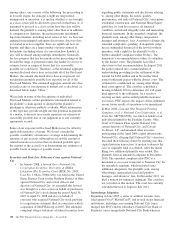
Gains (losses) on derivative instruments not designated in hedge relationships:
Derivatives Not Designated as Hedging Instruments under GAAP
Year ended
December 31
In millions 2011 2010
Derivatives used for residential mortgage banking activities:
Residential mortgage servicing
Interest rate contracts $571 $440
Loan sales
Interest rate contracts 54 (81)
Gains (losses) included in residential mortgage banking activities (a) $625 $359
Derivatives used for commercial mortgage banking activities:
Interest rate contracts $5$ (63)
Credit contracts 6(22)
Gains (losses) from commercial mortgage banking activities (b) $11 $ (85)
Derivatives used for customer-related activities:
Interest rate contracts $78 $16
Foreign exchange contracts 104 44
Equity contracts (3) (2)
Credit contracts 2
Gains (losses) from customer-related activities (b) $181 $58
Derivatives used for other risk management activities:
Interest rate contracts $ (43) $ (9)
Foreign exchange contracts (2) (6)
Credit contracts (1) 4
Other contracts (c) 11 86
Gains (losses) from other risk management activities (b) $ (35) $75
Total gains (losses) from derivatives not designated as hedging instruments $782 $407
(a) Included in residential mortgage noninterest income.
(b) Included in other noninterest income.
(c) Relates to BlackRock LTIP and other contracts.
C
REDIT
D
ERIVATIVES
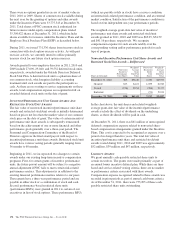
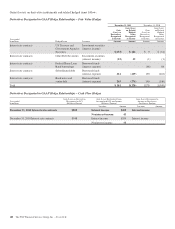
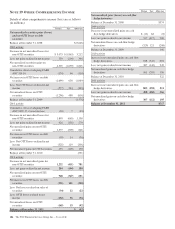
The credit derivative underlying is based on the credit risk of a specific entity, entities, or an index. As discussed above, we enter
into credit derivatives, specifically credit default swaps and risk participation agreements, as part of our commercial mortgage
banking hedging activities and for customer and other risk management purposes. Detail regarding credit default swaps and risk
participations sold follows:
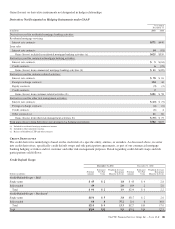
Credit Default Swaps
December 31, 2011 December 31, 2010
Dollars in millions
Notional
Amount
Estimated
Net Fair
Value
Weighted-Average
Remaining
Maturity In Years
Notional
Amount
Estimated
Net Fair
Value
Weighted-Average
Remaining
Maturity In Years
Credit Default Swaps – Sold
Single name $ 45 $ 2 1.8 $ 45 $ 4 2.8
Index traded 49 2.0 189 2 2.0
Total $ 94 $ 2 1.9 $234 $ 6 2.2
Credit Default Swaps – Purchased
Single name $150 $ 5 3.8 $317 $ 2 2.6
Index traded 60 4 37.2 210 8 38.8
Total $210 $ 9 13.3 $527 $10 17.0
Total $304 $11 9.8 $761 $16 12.5
The PNC Financial Services Group, Inc. – Form 10-K 181