PNC Bank 2011 Annual Report Download - page 142
Download and view the complete annual report
Please find page 142 of the 2011 PNC Bank annual report below. You can navigate through the pages in the report by either clicking on the pages listed below, or by using the keyword search tool below to find specific information within the annual report.-
 1
1 -
2
-
3
-
4
-
5
-
6
-
7
-
8
-
9
-
10
-
11
-
12
-
13
-
14
-
15
-
16
-
17
-
18
-
19
-
20
-
21
-
22
-
23
-
24
-
25
-
26
-
27
-
28
-
29
-
30
-
31
-
32
-
33
-
34
-
35
-
36
-
37
-
38
-
39
-
40
-
41
-
42
-
43
-
44
-
45
-
46
-
47
-
48
-
49
-
50
-
51
-
52
-
53
-
54
-
55
-
56
-
57
-
58
-
59
-
60
-
61
-
62
-
63
-
64
-
65
-
66
-
67
-
68
-
69
-
70
-
71
-
72
-
73
-
74
-
75
-
76
-
77
-
78
-
79
-
80
-
81
-
82
-
83
-
84
-
85
-
86
-
87
-
88
-
89
-
90
-
91
-
92
-
93
-
94
-
95
-
96
-
97
-
98
-
99
-
100
-
101
-
102
-
103
-
104
-
105
-
106
-
107
-
108
-
109
-
110
-
111
-
112
-
113
-
114
-
115
-
116
-
117
-
118
-
119
-
120
-
121
-
122
-
123
-
124
-
125
-
126
-
127
-
128
-
129
-
130
-
131
-
 132
132 -
 133
133 -
 134
134 -
 135
135 -
 136
136 -
 137
137 -
 138
138 -
 139
139 -
 140
140 -
 141
141 -
 142
142 -
 143
143 -
 144
144 -
 145
145 -
 146
146 -
 147
147 -
 148
148 -
 149
149 -
 150
150 -
 151
151 -
 152
152 -
153
-
154
-
155
-
156
-
157
-
158
-
159
-
160
-
161
-
162
-
163
-
164
-
165
-
166
-
167
-
168
-
169
-
170
-
171
-
172
-
173
-
174
-
175
-
176
-
177
-
178
-
179
-
180
-
181
-
182
-
183
-
184
-
185
-
186
-
187
-
188
-
189
-
190
-
191
-
192
-
193
-
194
-
195
-
196
-
197
-
198
-
199
-
200
-
201
-
202
-
203
-
204
-
205
-
206
-
207
-
208
-
209
-
210
-
211
-
212
-
213
-
214
-
215
-
216
-
217
-
218
-
219
-
220
-
221
-
222
-
223
-
224
-
225
-
226
-
227
-
228
-
229
-
230
-
231
-
232
-
233
-
234
-
235
-
236
-
237
-
238
 |
 |
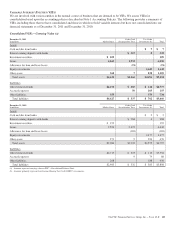
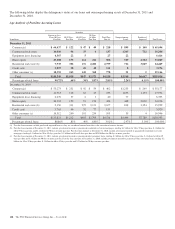
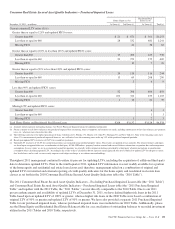
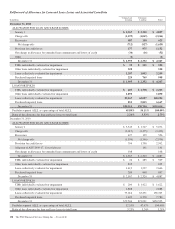
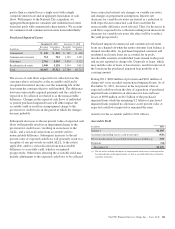
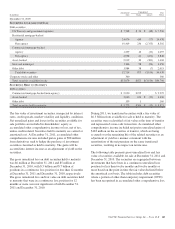
Consumer Real Estate Secured Asset Quality Indicators – Purchased Impaired Loans
Home Equity (a) (b)
Residential Real
Estate (a) (b)
December 31, 2011 - in millions 1st Liens (c) 2nd Liens (c) 1st Liens (c) Total (a)
Current estimated LTV ratios (d) (e)
Greater than or equal to 125% and updated FICO scores:
Greater than 660 $ 21 $ 871 $ 361 $1,253
Less than or equal to 660 28 532 681 1,241
Missing FICO 24 38 62
Greater than or equal to 100% to less than 125% and updated FICO scores:
Greater than 660 19 490 229 738
Less than or equal to 660 22 272 375 669
Missing FICO 19 7 26
Greater than or equal to 90% to less than 100% and updated FICO scores:
Greater than 660 10 118 116 244
Less than or equal to 660 13 69 208 290
Missing FICO 549
Less than 90% and updated FICO scores:
Greater than 660 52 398 404 854
Less than or equal to 660 102 322 679 1,103
Missing FICO 116 2239
Missing LTV and updated FICO scores:
Greater than 660 11
Less than or equal to 660 11
Missing FICO 123
Total Home Equity and Residential Real Estate Loans $268 $3,137 $3,128 $6,533
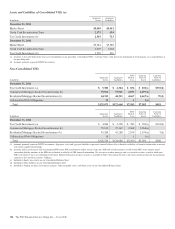
(a) Amounts shown represent outstanding balance. See Note 6 Purchased Impaired Loans for additional information.
(b) For the estimate of cash flows utilized in our purchased impaired loan accounting, other assumptions and estimates are made, including amortization of first lien balances, pre-payment
rates, etc., which are not reflected in this table.
(c) The following states have the highest percentage of loans: California 22%, Florida 13%, Illinois 12%, Ohio 9%, Michigan 5% and New York 4%. None of the remaining states have
above 3% concentration of purchased impaired, however, on a collective basis the remaining states make up 35% of the purchased impaired portfolio.
(d) Based upon updated LTV (inclusive of CLTV for second lien positions).
(e) Updated LTV (inclusive of CLTV for second lien positions) are estimated using modeled property values. These ratios are updated at least annually. The related estimates and inputs
are based upon an approach that uses a combination of third-party AVMs, HPI indices, property location, internal and external balance information, origination data and management
assumptions. In cases where we are in an originated second lien position, we generally utilize origination balances provided by a third-party which do not include an amortization
assumption when calculating updated LTV. Accordingly, the results of these calculations do not represent actual appraised loan level collateral or updated LTV based upon a current
first lien balance, and as such, are necessarily imprecise and subject to change as we enhance our methodology.
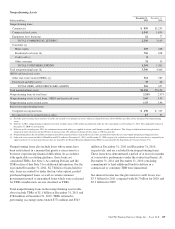
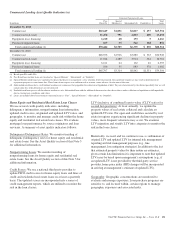
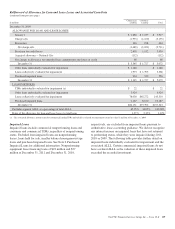
Throughout 2011 management continued to refine its process for updating LTVs, including the acquisition of additional third-party
data to determine updated LTVs. Prior to the fourth quarter 2011, updated LTV information was not readily available for a portion
of the home equity and residential real estate loan classes and, therefore, management relied on a combination of original and
updated LTVs for internal and external reporting of credit quality indicators for the home equity and residential real estate loan
classes as set forth in the 2010 Consumer Real Estate Secured Asset Quality Indicators table (the “2010 Table”).
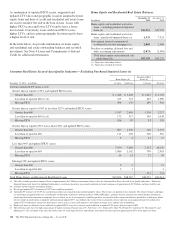
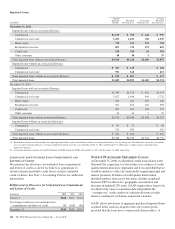
The 2011 Consumer Real Estate Secured Asset Quality Indicators – Excluding Purchased Impaired Loans table (the “2011 Table”)
and Consumer Real Estate Secured Asset Quality Indicators – Purchased Impaired Loans table (the “2011 Purchased Impaired
Table” and together with the 2011 Table, the “2011 Tables”) are not directly comparable to the 2010 Table. Due to our 2011
process enhancements and availability of updated LTVs at December 31, 2011, we have defined higher risk loans in the 2011
Table based upon an updated LTV of 100% or greater, whereas higher risk loans in the 2010 Table were based a combination of
original LTV of 90% or greater and updated LTV of 90% or greater. We have also provided a separate 2011 Purchased Impaired
Table for our purchased impaired loans, whereas purchased impaired loans were included in our 2010 Table. Additionally, please
see the Home Equity and Residential Real Estate Balances table for a reconciliation of outstanding balances to recorded investment
utilized in the 2011 Tables and 2010 Table, respectively.
The PNC Financial Services Group, Inc. – Form 10-K 133