PNC Bank 2011 Annual Report Download - page 156
Download and view the complete annual report
Please find page 156 of the 2011 PNC Bank annual report below. You can navigate through the pages in the report by either clicking on the pages listed below, or by using the keyword search tool below to find specific information within the annual report.-
 1
1 -
2
-
3
-
4
-
5
-
6
-
7
-
8
-
9
-
10
-
11
-
12
-
13
-
14
-
15
-
16
-
17
-
18
-
19
-
20
-
21
-
22
-
23
-
24
-
25
-
26
-
27
-
28
-
29
-
30
-
31
-
32
-
33
-
34
-
35
-
36
-
37
-
38
-
39
-
40
-
41
-
42
-
43
-
44
-
45
-
46
-
47
-
48
-
49
-
50
-
51
-
52
-
53
-
54
-
55
-
56
-
57
-
58
-
59
-
60
-
61
-
62
-
63
-
64
-
65
-
66
-
67
-
68
-
69
-
70
-
71
-
72
-
73
-
74
-
75
-
76
-
77
-
78
-
79
-
80
-
81
-
82
-
83
-
84
-
85
-
86
-
87
-
88
-
89
-
90
-
91
-
92
-
93
-
94
-
95
-
96
-
97
-
98
-
99
-
100
-
101
-
102
-
103
-
104
-
105
-
106
-
107
-
108
-
109
-
110
-
111
-
112
-
113
-
114
-
115
-
116
-
117
-
118
-
119
-
120
-
121
-
122
-
123
-
124
-
125
-
126
-
127
-
128
-
129
-
130
-
131
-
132
-
133
-
134
-
135
-
136
-
137
-
138
-
139
-
140
-
141
-
142
-
143
-
144
-
145
-
 146
146 -
 147
147 -
 148
148 -
 149
149 -
 150
150 -
 151
151 -
 152
152 -
 153
153 -
 154
154 -
 155
155 -
 156
156 -
 157
157 -
 158
158 -
 159
159 -
 160
160 -
 161
161 -
 162
162 -
 163
163 -
 164
164 -
 165
165 -
 166
166 -
167
-
168
-
169
-
170
-
171
-
172
-
173
-
174
-
175
-
176
-
177
-
178
-
179
-
180
-
181
-
182
-
183
-
184
-
185
-
186
-
187
-
188
-
189
-
190
-
191
-
192
-
193
-
194
-
195
-
196
-
197
-
198
-
199
-
200
-
201
-
202
-
203
-
204
-
205
-
206
-
207
-
208
-
209
-
210
-
211
-
212
-
213
-
214
-
215
-
216
-
217
-
218
-
219
-
220
-
221
-
222
-
223
-
224
-
225
-
226
-
227
-
228
-
229
-
230
-
231
-
232
-
233
-
234
-
235
-
236
-
237
-
238
 |
 |
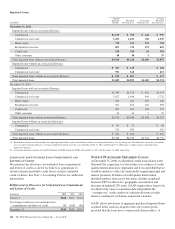
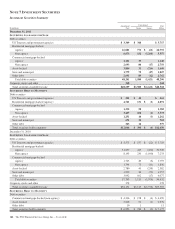
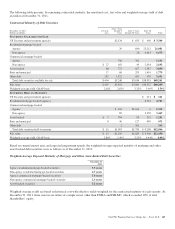
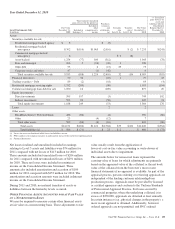
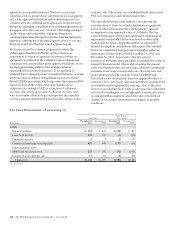
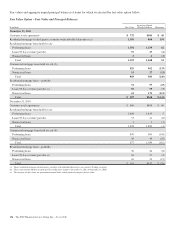
The following table presents, by remaining contractual maturity, the amortized cost, fair value and weighted-average yield of debt
securities at December 31, 2011.
Contractual Maturity of Debt Securities
December 31, 2011
Dollars in millions
1 Year or
Less
After 1 Year
through 5
Years
After 5 Years
through 10 Years
After 10
Years Total
S
ECURITIES
A
VAILABLE FOR
S
ALE
US Treasury and government agencies $2,134 $ 835 $ 400 $ 3,369
Residential mortgage-backed
Agency 29 840 25,212 26,081
Non-agency 28 6,645 6,673
Commercial mortgage-backed
Agency 740 361 1,101
Non-agency $ 27 183 49 2,434 2,693
Asset-backed 68 772 627 2,387 3,854
State and municipal 17 68 293 1,401 1,779
Other debt 292 1,322 601 476 2,691
Total debt securities available for sale $ 404 $5,248 $3,634 $38,955 $48,241
Fair value $ 407 $5,401 $3,860 $38,532 $48,200
Weighted-average yield, GAAP basis 2.62% 2.83% 3.35% 3.69% 3.56%
S
ECURITIES
H
ELD TO
M
ATURITY
US Treasury and government agencies $ 221 $ 221
Residential mortgage-backed (agency) 4,761 4,761
Commercial mortgage-backed
Agency $ 162 $1,164 6 1,332
Non-agency 89 3,378 3,467
Asset-backed $ 7 794 98 352 1,251
State and municipal 8 46 127 490 671
Other debt 2 361 363
Total debt securities held to maturity $ 15 $1,093 $1,750 $ 9,208 $12,066
Fair value $ 15 $1,109 $1,820 $ 9,506 $12,450
Weighted-average yield, GAAP basis 2.86% 2.49% 3.29% 4.44% 4.09%
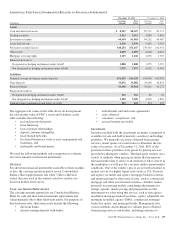
Based on current interest rates and expected prepayment speeds, the weighted-average expected maturity of mortgage and other
asset-backed debt securities were as follows as of December 31, 2011:
Weighted-Average Expected Maturity of Mortgage and Other Asset-Backed Debt Securities
December 31
2011
Agency residential mortgage-backed securities 3.3 years
Non-agency residential mortgage-backed securities 4.7 years
Agency commercial mortgage-backed securities 5.4 years
Non-agency commercial mortgage-backed securities 2.6 years
Asset-backed securities 3.2 years
Weighted-average yields are based on historical cost with effective yields weighted for the contractual maturity of each security. At
December 31, 2011, there were no securities of a single issuer, other than FNMA and FHLMC, which exceeded 10% of total
shareholders’ equity.
The PNC Financial Services Group, Inc. – Form 10-K 147