PNC Bank 2011 Annual Report Download - page 91
Download and view the complete annual report
Please find page 91 of the 2011 PNC Bank annual report below. You can navigate through the pages in the report by either clicking on the pages listed below, or by using the keyword search tool below to find specific information within the annual report.-
 1
1 -
2
-
3
-
4
-
5
-
6
-
7
-
8
-
9
-
10
-
11
-
12
-
13
-
14
-
15
-
16
-
17
-
18
-
19
-
20
-
21
-
22
-
23
-
24
-
25
-
26
-
27
-
28
-
29
-
30
-
31
-
32
-
33
-
34
-
35
-
36
-
37
-
38
-
39
-
40
-
41
-
42
-
43
-
44
-
45
-
46
-
47
-
48
-
49
-
50
-
51
-
52
-
53
-
54
-
55
-
56
-
57
-
58
-
59
-
60
-
61
-
62
-
63
-
64
-
65
-
66
-
67
-
68
-
69
-
70
-
71
-
72
-
73
-
74
-
75
-
76
-
77
-
78
-
79
-
80
-
 81
81 -
 82
82 -
 83
83 -
 84
84 -
 85
85 -
 86
86 -
 87
87 -
 88
88 -
 89
89 -
 90
90 -
 91
91 -
 92
92 -
 93
93 -
 94
94 -
 95
95 -
 96
96 -
 97
97 -
 98
98 -
 99
99 -
 100
100 -
 101
101 -
102
-
103
-
104
-
105
-
106
-
107
-
108
-
109
-
110
-
111
-
112
-
113
-
114
-
115
-
116
-
117
-
118
-
119
-
120
-
121
-
122
-
123
-
124
-
125
-
126
-
127
-
128
-
129
-
130
-
131
-
132
-
133
-
134
-
135
-
136
-
137
-
138
-
139
-
140
-
141
-
142
-
143
-
144
-
145
-
146
-
147
-
148
-
149
-
150
-
151
-
152
-
153
-
154
-
155
-
156
-
157
-
158
-
159
-
160
-
161
-
162
-
163
-
164
-
165
-
166
-
167
-
168
-
169
-
170
-
171
-
172
-
173
-
174
-
175
-
176
-
177
-
178
-
179
-
180
-
181
-
182
-
183
-
184
-
185
-
186
-
187
-
188
-
189
-
190
-
191
-
192
-
193
-
194
-
195
-
196
-
197
-
198
-
199
-
200
-
201
-
202
-
203
-
204
-
205
-
206
-
207
-
208
-
209
-
210
-
211
-
212
-
213
-
214
-
215
-
216
-
217
-
218
-
219
-
220
-
221
-
222
-
223
-
224
-
225
-
226
-
227
-
228
-
229
-
230
-
231
-
232
-
233
-
234
-
235
-
236
-
237
-
238
 |
 |
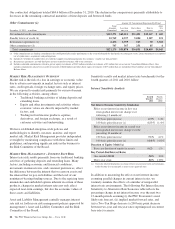
We establish specific allowances for loans considered
impaired using methods prescribed by GAAP. All impaired
loans are subject to individual analysis, except leases and
large groups of smaller-balance homogeneous loans which
may include, but are not limited to, credit card, residential
mortgage, and consumer installment loans. Specific
allowances for individual loans (including commercial and
consumer TDRs) are determined based on an analysis of the
present value of expected future cash flows from the loans
discounted at their effective interest rate, observable market
price, or the fair value of the underlying collateral.
Allocations to non-impaired commercial loan classes are
based on PD and LGD credit risk ratings.
Our pool reserve methodology is sensitive to changes in key
risk parameters such as PDs, LGDs and EADs. In general, a
given change in any of the major risk parameters will have a
corresponding change in the pool reserve allocations for
non-impaired commercial loans. Our commercial loans are the
largest category of credits and are most sensitive to changes in
the key risk parameters and pool reserve loss rates. To
illustrate, if we increase the pool reserve LGD by 5% for all
categories of non-impaired commercial loans, then the
aggregate of the ALLL and allowance for unfunded loan
commitments and letters of credit would increase by $72
million.
The majority of the commercial portfolio is secured by
collateral, including loans to asset-based lending customers
that continue to show demonstrably lower loss given default.
Further, the large investment grade or equivalent portion of
the loan portfolio has performed well and has not been subject
to significant deterioration. Additionally, guarantees on loans
greater than $1 million and owner guarantees for small
business loans do not significantly impact our ALLL.
Allocations to non-impaired consumer loan classes are based
upon a roll-rate model which uses statistical relationships,
calculated from historical data that estimate the movement of
loan outstandings through the various stages of delinquency
and ultimately charge-off.
The ALLL is lower than it would have been otherwise due to
the accounting treatment for purchased impaired loans. This
treatment also results in a lower ratio of ALLL to total loans.
Loan loss reserves on the purchased impaired loans were not
carried over on the date of acquisition. As of December 31,
2011, we have established reserves of $998 million for
purchased impaired loans.
A portion of the ALLL related to qualitative and measurement
factors has been assigned to loan categories. These factors
include, but are not limited to, the following:
• Industry concentrations and conditions,
• Recent credit quality trends,
• Recent loss experience in particular portfolios,
• Recent macro economic factors,
• Changes in risk selection and underwriting standards,
and
• Timing of available information.
In addition to the ALLL, we maintain an allowance for
unfunded loan commitments and letters of credit. We report
this allowance as a liability on our Consolidated Balance
Sheet. We maintain the allowance for unfunded loan
commitments and letters of credit at a level we believe is
appropriate to absorb estimated probable losses on these
unfunded credit facilities. We determine this amount using
estimates of the probability of the ultimate funding and losses
related to those credit exposures. This methodology is very
similar to the one we use for determining our ALLL.
We refer you to Note 5 Asset Quality and Allowances for
Loan and Lease Losses and Unfunded Loan Commitments and
Letters of Credit in the Notes To Consolidated Financial
Statements in Item 8 of this Report for further information on
key asset quality indicators that we use to evaluate our
portfolio and establish the allowances.
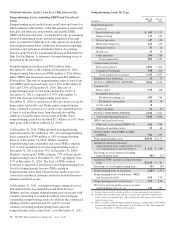
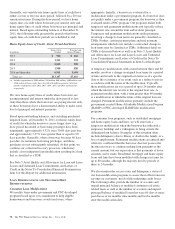
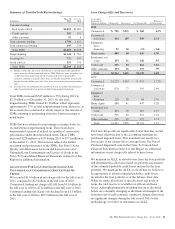
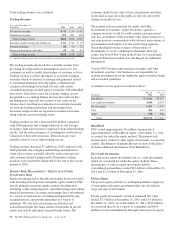
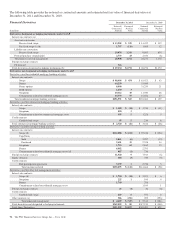
Allowance for Loan and Lease Losses
Dollars in millions 2011 2010
January 1 $ 4,887 $ 5,072
Total net charge-offs (1,639) (2,936)
Provision for credit losses 1,152 2,502
Adoption of ASU 2009-17, Consolidations 141
Net change in allowance for unfunded loan
commitments and letters of credit (52) 108
Other (1)
December 31 $ 4,347 $ 4,887
Net charge-offs to average loans (for the
year ended) 1.08% 1.91%
Allowance for loan and lease losses to total
loans 2.73 3.25
Commercial lending net charge-offs $ (712) $(1,590)
Consumer lending net charge-offs (927) (1,346)
Total net charge-offs $(1,639) $(2,936)
Net charge-offs to average loans (for the
year ended)
Commercial lending .86% 1.96%
Consumer lending 1. 33 1.85
As further described in the Consolidated Income Statement
Review section of this Item 7, the provision for credit losses
totaled $1.2 billion for the full year of 2011 compared to $2.5
billion for the full year of 2010. For the full year of 2011, the
provision for commercial lending credit losses declined by
$527 million or 75% from the full year of 2010. Similarly, the
provision for consumer lending credit losses decreased $823
million or 46% from the full year of 2010.
82 The PNC Financial Services Group, Inc. – Form 10-K