PNC Bank 2011 Annual Report Download - page 147
Download and view the complete annual report
Please find page 147 of the 2011 PNC Bank annual report below. You can navigate through the pages in the report by either clicking on the pages listed below, or by using the keyword search tool below to find specific information within the annual report.-
 1
1 -
2
-
3
-
4
-
5
-
6
-
7
-
8
-
9
-
10
-
11
-
12
-
13
-
14
-
15
-
16
-
17
-
18
-
19
-
20
-
21
-
22
-
23
-
24
-
25
-
26
-
27
-
28
-
29
-
30
-
31
-
32
-
33
-
34
-
35
-
36
-
37
-
38
-
39
-
40
-
41
-
42
-
43
-
44
-
45
-
46
-
47
-
48
-
49
-
50
-
51
-
52
-
53
-
54
-
55
-
56
-
57
-
58
-
59
-
60
-
61
-
62
-
63
-
64
-
65
-
66
-
67
-
68
-
69
-
70
-
71
-
72
-
73
-
74
-
75
-
76
-
77
-
78
-
79
-
80
-
81
-
82
-
83
-
84
-
85
-
86
-
87
-
88
-
89
-
90
-
91
-
92
-
93
-
94
-
95
-
96
-
97
-
98
-
99
-
100
-
101
-
102
-
103
-
104
-
105
-
106
-
107
-
108
-
109
-
110
-
111
-
112
-
113
-
114
-
115
-
116
-
117
-
118
-
119
-
120
-
121
-
122
-
123
-
124
-
125
-
126
-
127
-
128
-
129
-
130
-
131
-
132
-
133
-
134
-
135
-
136
-
 137
137 -
 138
138 -
 139
139 -
 140
140 -
 141
141 -
 142
142 -
 143
143 -
 144
144 -
 145
145 -
 146
146 -
 147
147 -
 148
148 -
 149
149 -
 150
150 -
 151
151 -
 152
152 -
 153
153 -
 154
154 -
 155
155 -
 156
156 -
 157
157 -
158
-
159
-
160
-
161
-
162
-
163
-
164
-
165
-
166
-
167
-
168
-
169
-
170
-
171
-
172
-
173
-
174
-
175
-
176
-
177
-
178
-
179
-
180
-
181
-
182
-
183
-
184
-
185
-
186
-
187
-
188
-
189
-
190
-
191
-
192
-
193
-
194
-
195
-
196
-
197
-
198
-
199
-
200
-
201
-
202
-
203
-
204
-
205
-
206
-
207
-
208
-
209
-
210
-
211
-
212
-
213
-
214
-
215
-
216
-
217
-
218
-
219
-
220
-
221
-
222
-
223
-
224
-
225
-
226
-
227
-
228
-
229
-
230
-
231
-
232
-
233
-
234
-
235
-
236
-
237
-
238
 |
 |

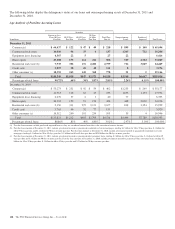
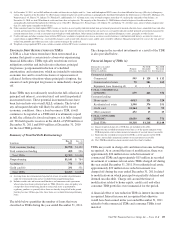
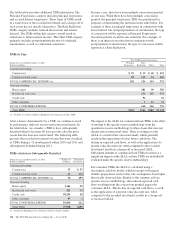
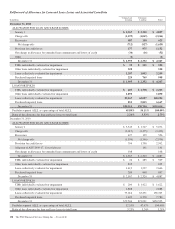
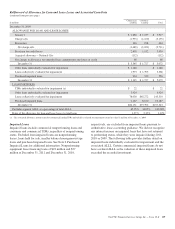
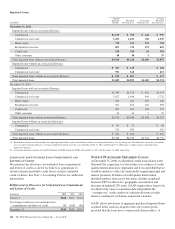
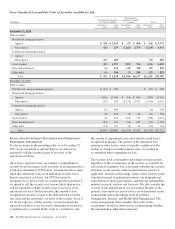
Rollforward of Allowance for Loan and Lease Losses and Associated Loan Data
In millions
Commercial
Lending
Consumer
Lending Total
December 31, 2011
ALLOWANCE FOR LOAN AND LEASE LOSSES
January 1 $ 2,567 $ 2,320 $ 4,887
Charge-offs (1,199) (1,065) (2,264)
Recoveries 487 138 625
Net charge-offs (712) (927) (1,639)
Provision for credit losses 177 975 1,152
Net change in allowance for unfunded loan commitments and letters of credit (36) (16) (52)
Other (1) (1)
December 31 $ 1,995 $ 2,352 $ 4,347
TDRs individually evaluated for impairment $ 39 $ 541 $ 580
Other loans individually evaluated for impairment 520 520
Loans collectively evaluated for impairment 1,207 1,042 2,249
Purchased impaired loans 229 769 998
December 31 $ 1,995 $ 2,352 $ 4,347
LOAN PORTFOLIO
TDRs individually evaluated for impairment $ 405 $ 1,798 $ 2,203
Other loans individually evaluated for impairment 1,890 1,890
Loans collectively evaluated for impairment 85,167 63,087 148,254
Purchased impaired loans 852 5,815 6,667
December 31 $88,314 $70,700 $159,014
Portfolio segment ALLL as a percentage of total ALLL 45.89% 54.11% 100.00%
Ratio of the allowance for loan and lease losses to total loans 2.26% 3.33% 2.73%
December 31, 2010
ALLOWANCE FOR LOAN AND LEASE LOSSES
January 1 $ 3,345 $ 1,727 $ 5,072
Charge-offs (2,017) (1,475) (3,492)
Recoveries 427 129 556
Net charge-offs (1,590) (1,346) (2,936)
Provision for credit losses 704 1,798 2,502
Adoption of ASU 2009-17, Consolidations 141 141
Net change in allowance for unfunded loan commitments and letters of credit 108 108
December 31 $ 2,567 $ 2,320 $ 4,887
TDRs individually evaluated for impairment $ 24 $ 485 $ 509
Other loans individually evaluated for impairment 835 835
Loans collectively evaluated for impairment 1,419 1,227 2,646
Purchased impaired loans 289 608 897
December 31 $ 2,567 $ 2,320 $ 4,887
LOAN PORTFOLIO
TDRs individually evaluated for impairment $ 200 $ 1,422 $ 1,622
Other loans individually evaluated for impairment 2,888 2,888
Loans collectively evaluated for impairment 75,014 63,291 138,305
Purchased impaired loans 1,402 6,378 7,780
December 31 $79,504 $71,091 $150,595
Portfolio segment ALLL as a percentage of total ALLL 52.53% 47.47% 100.00%
Ratio of the allowance for loan and lease losses to total loans 3.23% 3.26% 3.25%
138 The PNC Financial Services Group, Inc. – Form 10-K