PNC Bank 2011 Annual Report Download - page 83
Download and view the complete annual report
Please find page 83 of the 2011 PNC Bank annual report below. You can navigate through the pages in the report by either clicking on the pages listed below, or by using the keyword search tool below to find specific information within the annual report.-
 1
1 -
2
-
3
-
4
-
5
-
6
-
7
-
8
-
9
-
10
-
11
-
12
-
13
-
14
-
15
-
16
-
17
-
18
-
19
-
20
-
21
-
22
-
23
-
24
-
25
-
26
-
27
-
28
-
29
-
30
-
31
-
32
-
33
-
34
-
35
-
36
-
37
-
38
-
39
-
40
-
41
-
42
-
43
-
44
-
45
-
46
-
47
-
48
-
49
-
50
-
51
-
52
-
53
-
54
-
55
-
56
-
57
-
58
-
59
-
60
-
61
-
62
-
63
-
64
-
65
-
66
-
67
-
68
-
69
-
70
-
71
-
72
-
 73
73 -
 74
74 -
 75
75 -
 76
76 -
 77
77 -
 78
78 -
 79
79 -
 80
80 -
 81
81 -
 82
82 -
 83
83 -
 84
84 -
 85
85 -
 86
86 -
 87
87 -
 88
88 -
 89
89 -
 90
90 -
 91
91 -
 92
92 -
 93
93 -
94
-
95
-
96
-
97
-
98
-
99
-
100
-
101
-
102
-
103
-
104
-
105
-
106
-
107
-
108
-
109
-
110
-
111
-
112
-
113
-
114
-
115
-
116
-
117
-
118
-
119
-
120
-
121
-
122
-
123
-
124
-
125
-
126
-
127
-
128
-
129
-
130
-
131
-
132
-
133
-
134
-
135
-
136
-
137
-
138
-
139
-
140
-
141
-
142
-
143
-
144
-
145
-
146
-
147
-
148
-
149
-
150
-
151
-
152
-
153
-
154
-
155
-
156
-
157
-
158
-
159
-
160
-
161
-
162
-
163
-
164
-
165
-
166
-
167
-
168
-
169
-
170
-
171
-
172
-
173
-
174
-
175
-
176
-
177
-
178
-
179
-
180
-
181
-
182
-
183
-
184
-
185
-
186
-
187
-
188
-
189
-
190
-
191
-
192
-
193
-
194
-
195
-
196
-
197
-
198
-
199
-
200
-
201
-
202
-
203
-
204
-
205
-
206
-
207
-
208
-
209
-
210
-
211
-
212
-
213
-
214
-
215
-
216
-
217
-
218
-
219
-
220
-
221
-
222
-
223
-
224
-
225
-
226
-
227
-
228
-
229
-
230
-
231
-
232
-
233
-
234
-
235
-
236
-
237
-
238
 |
 |
N
ONPERFORMING
A
SSETS AND
L
OAN
D
ELINQUENCIES
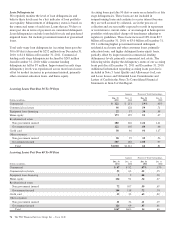
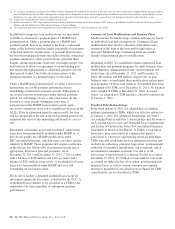
Nonperforming Assets, including OREO and Foreclosed
Assets
Nonperforming assets include nonaccrual loans and leases for
which ultimate collectability of the full amount of contractual
principal and interest is not probable and include TDRs,
OREO and foreclosed assets. Loans held for sale, government
insured or guaranteed loans, purchased impaired loans and
loans accounted for under the fair value option are excluded
from nonperforming loans. Additional information regarding
our nonaccrual policies is included in Note 1 Accounting
Policies in the Notes To Consolidated Financial Statements in
Item 8 of this Report. A summary of nonperforming assets is
presented in the table below.
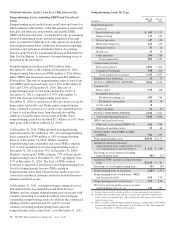
Nonperforming assets decreased $967 million from
December 31, 2010, to $4.2 billion at December 31, 2011.
Nonperforming loans decreased $906 million to $3.6 billion
while OREO and foreclosed assets decreased $61 million to
$596 million. The ratio of nonperforming assets to total loans
and OREO and foreclosed assets was 2.60% at December 31,
2011 and 3.39% at December 31, 2010. The ratio of
nonperforming loans to total loans declined to 2.24% at
December 31, 2011, compared to 2.97% at December 31,
2010. The decrease in nonperforming loans from
December 31, 2010 occurred across all loan classes except for
home equity and credit card. Home equity nonperforming
loans continued to increase as a result of the extended period
of time to exit problem loans from the portfolio and the
additions of modifications which result in TDRs. Total
nonperforming assets have declined $2.3 billion, or 35%, from
their peak of $6.4 billion at March 31, 2010.
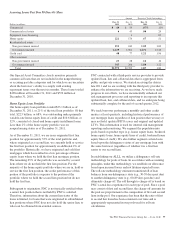
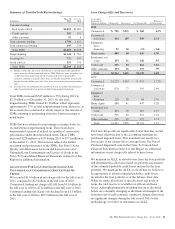
At December 31, 2011, TDRs included in nonperforming
loans increased to $1.1 billion or 32% of total nonperforming
loans compared to $784 million or 18% of nonperforming
loans as of December 31, 2010. Within consumer
nonperforming loans, residential real estate TDRs comprise
51% of total residential real estate nonperforming loans at
December 31, 2011, up from 30% at December 31, 2010.
Similarly, home equity TDRs comprise 77% of home equity
nonperforming loans at December 31, 2011, up slightly from
75% at December 31, 2010. The level of TDRs in these
portfolios is expected to result in elevated nonperforming loan
levels for longer periods because TDRs remain in
nonperforming status until a borrower has made at least six
consecutive months of payments under the modified terms or
ultimate resolution occurs.
At December 31, 2011, our largest nonperforming asset was
$28 million in the Accommodation and Food Services
Industry and our average nonperforming loan associated with
commercial lending was under $1 million. Our ten largest
outstanding nonperforming assets are all from the commercial
lending portfolio and represent 9% and 5% of total
commercial lending nonperforming loans and total
nonperforming assets, respectively, as of December 31, 2011.
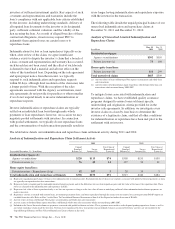
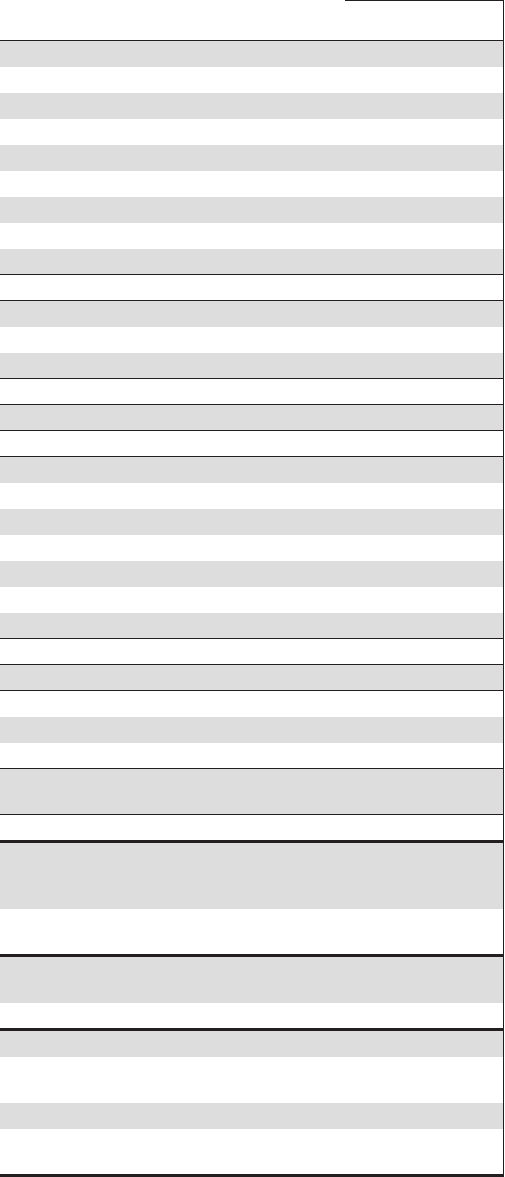
Nonperforming Assets By Type
In millions
Dec. 31
2011
Dec. 31
2010
Nonperforming loans
Commercial
Retail/wholesale trade $ 109 $ 197
Manufacturing 117 250
Service providers 147 218
Real estate related (a) 252 233
Financial services 36 16
Health care 29 50
Other industries 209 289
Total commercial 899 1,253
Commercial real estate
Real estate projects 1,051 1,422
Commercial mortgage 294 413
Total commercial real estate 1,345 1,835
Equipment lease financing 22 77
TOTAL COMMERCIAL LENDING 2,266 3,165
Consumer (b)
Home equity 529 448
Residential real estate
Residential mortgage (c) 685 764
Residential construction 41 54
Credit card (d) 8
Other consumer 31 35
TOTAL CONSUMER LENDING 1,294 1,301
Total nonperforming loans (e) 3,560 4,466
OREO and foreclosed assets
Other real estate owned (OREO) (f) 561 589
Foreclosed and other assets 35 68
TOTAL OREO AND FORECLOSED
ASSETS 596 657
Total nonperforming assets $4,156 $5,123
Amount of commercial lending
nonperforming loans contractually current
as to remaining principal and interest $ 632 $ 988
Percentage of total commercial lending
nonperforming loans 28% 31%
Amount of TDRs included in nonperforming
loans $1,141 $ 784
Percentage of total nonperforming loans 32% 18%
Nonperforming loans to total loans 2.24% 2.97%
Nonperforming assets to total loans, OREO
and foreclosed assets 2.60 3.39
Nonperforming assets to total assets 1.53 1.94
Allowance for loan and lease losses to total
nonperforming loans (e) (g) 122 109
(a) Includes loans related to customers in the real estate and construction industries.
(b) Excludes most consumer loans and lines of credit, not secured by residential real
estate, which are charged off after 120 to 180 days past due and are not placed on
nonperforming status.
(c) Effective in 2011, nonperforming residential mortgage excludes loans of $61 million
accounted for under the fair value option as of December 31, 2011. The comparable
balance at December 31, 2010 was not material.
74 The PNC Financial Services Group, Inc. – Form 10-K