PNC Bank 2011 Annual Report Download - page 152
Download and view the complete annual report
Please find page 152 of the 2011 PNC Bank annual report below. You can navigate through the pages in the report by either clicking on the pages listed below, or by using the keyword search tool below to find specific information within the annual report.-
 1
1 -
2
-
3
-
4
-
5
-
6
-
7
-
8
-
9
-
10
-
11
-
12
-
13
-
14
-
15
-
16
-
17
-
18
-
19
-
20
-
21
-
22
-
23
-
24
-
25
-
26
-
27
-
28
-
29
-
30
-
31
-
32
-
33
-
34
-
35
-
36
-
37
-
38
-
39
-
40
-
41
-
42
-
43
-
44
-
45
-
46
-
47
-
48
-
49
-
50
-
51
-
52
-
53
-
54
-
55
-
56
-
57
-
58
-
59
-
60
-
61
-
62
-
63
-
64
-
65
-
66
-
67
-
68
-
69
-
70
-
71
-
72
-
73
-
74
-
75
-
76
-
77
-
78
-
79
-
80
-
81
-
82
-
83
-
84
-
85
-
86
-
87
-
88
-
89
-
90
-
91
-
92
-
93
-
94
-
95
-
96
-
97
-
98
-
99
-
100
-
101
-
102
-
103
-
104
-
105
-
106
-
107
-
108
-
109
-
110
-
111
-
112
-
113
-
114
-
115
-
116
-
117
-
118
-
119
-
120
-
121
-
122
-
123
-
124
-
125
-
126
-
127
-
128
-
129
-
130
-
131
-
132
-
133
-
134
-
135
-
136
-
137
-
138
-
139
-
140
-
141
-
 142
142 -
 143
143 -
 144
144 -
 145
145 -
 146
146 -
 147
147 -
 148
148 -
 149
149 -
 150
150 -
 151
151 -
 152
152 -
 153
153 -
 154
154 -
 155
155 -
 156
156 -
 157
157 -
 158
158 -
 159
159 -
 160
160 -
 161
161 -
 162
162 -
163
-
164
-
165
-
166
-
167
-
168
-
169
-
170
-
171
-
172
-
173
-
174
-
175
-
176
-
177
-
178
-
179
-
180
-
181
-
182
-
183
-
184
-
185
-
186
-
187
-
188
-
189
-
190
-
191
-
192
-
193
-
194
-
195
-
196
-
197
-
198
-
199
-
200
-
201
-
202
-
203
-
204
-
205
-
206
-
207
-
208
-
209
-
210
-
211
-
212
-
213
-
214
-
215
-
216
-
217
-
218
-
219
-
220
-
221
-
222
-
223
-
224
-
225
-
226
-
227
-
228
-
229
-
230
-
231
-
232
-
233
-
234
-
235
-
236
-
237
-
238
 |
 |

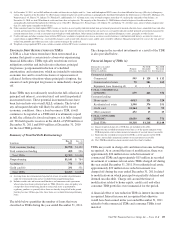
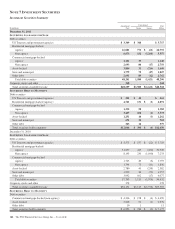
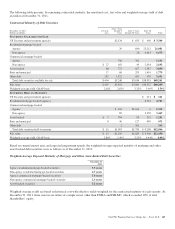
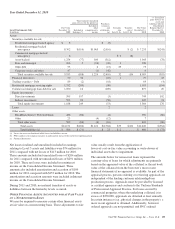
In millions
Amortized
Cost
Unrealized Fair
ValueGains Losses
December 31, 2009
S
ECURITIES
A
VAILABLE FOR
S
ALE
Debt securities
US Treasury and government agencies $ 7,548 $ 20 $ (48) $ 7,520
Residential mortgage-backed
Agency 24,076 439 (77) 24,438
Non-agency 10,419 236 (2,353) 8,302
Commercial mortgage-backed
Agency 1,299 10 (12) 1,297
Non-agency 4,028 42 (222) 3,848
Asset-backed 2,019 30 (381) 1,668
State and municipal 1,346 58 (54) 1,350
Other debt 1,984 38 (7) 2,015
Total debt securities 52,719 873 (3,154) 50,438
Corporate stocks and other 360 360
Total securities available for sale $53,079 $873 $(3,154) $50,798
S
ECURITIES
H
ELD TO
M
ATURITY
Debt securities
Commercial mortgage-backed (non-agency) $ 2,030 $195 $ 2,225
Asset-backed 3,040 109 $ (13) 3,136
Other debt 159 1 160
Total securities held to maturity $ 5,229 $305 $ (13) $ 5,521
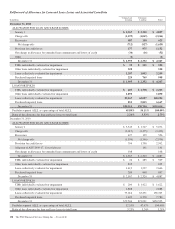
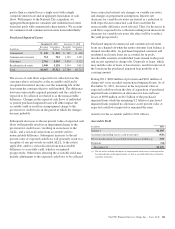
The fair value of investment securities is impacted by interest
rates, credit spreads, market volatility and liquidity conditions.
Net unrealized gains and losses in the securities available for
sale portfolio are included in shareholders’ equity as
accumulated other comprehensive income or loss, net of tax,
unless credit-related. Securities held to maturity are carried at
amortized cost. At December 31, 2011, accumulated other
comprehensive income included pretax gains of $98 million
from derivatives used to hedge the purchase of investment
securities classified as held to maturity. The gains will be
accreted into interest income as an adjustment of yield on the
securities.
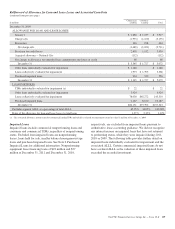
The gross unrealized loss on debt securities held to maturity
was $6 million at December 31, 2011 and $5 million at
December 31, 2010, with $.5 billion and $.7 billion of
positions in a continuous loss position for less than 12 months
at December 31, 2011 and December 31, 2010, respectively.
The gross unrealized loss and fair value on debt securities held
to maturity that were in a continuous loss position for 12
months or more were not significant at both December 31,
2011 and December 31, 2010.
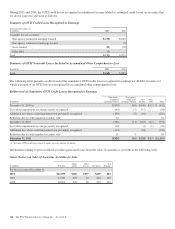
During 2011, we transferred securities with a fair value of
$6.3 billion from available for sale to held to maturity. The
securities were reclassified at fair value at the time of transfer
and represented a non-cash transaction. Accumulated other
comprehensive income included net pretax unrealized gains of
$183 million on the securities at transfer, which are being
accreted over the remaining life of the related securities as an
adjustment of yield in a manner consistent with the
amortization of the net premium on the same transferred
securities, resulting in no impact on net income.
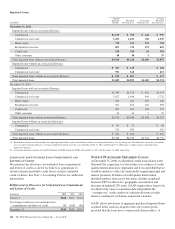
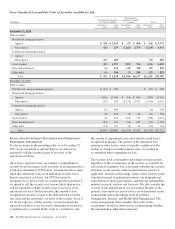
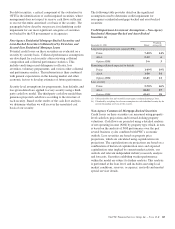
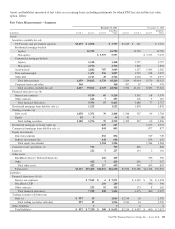
The following table presents gross unrealized loss and fair
value of securities available for sale at December 31, 2011 and
December 31, 2010. The securities are segregated between
investments that have been in a continuous unrealized loss
position for less than twelve months and twelve months or
more based on the point in time the fair value declined below
the amortized cost basis. The table includes debt securities
where a portion of other-than-temporary impairment (OTTI)
has been recognized in accumulated other comprehensive loss.
The PNC Financial Services Group, Inc. – Form 10-K 143