PNC Bank 2011 Annual Report Download - page 191
Download and view the complete annual report
Please find page 191 of the 2011 PNC Bank annual report below. You can navigate through the pages in the report by either clicking on the pages listed below, or by using the keyword search tool below to find specific information within the annual report.-
 1
1 -
2
-
3
-
4
-
5
-
6
-
7
-
8
-
9
-
10
-
11
-
12
-
13
-
14
-
15
-
16
-
17
-
18
-
19
-
20
-
21
-
22
-
23
-
24
-
25
-
26
-
27
-
28
-
29
-
30
-
31
-
32
-
33
-
34
-
35
-
36
-
37
-
38
-
39
-
40
-
41
-
42
-
43
-
44
-
45
-
46
-
47
-
48
-
49
-
50
-
51
-
52
-
53
-
54
-
55
-
56
-
57
-
58
-
59
-
60
-
61
-
62
-
63
-
64
-
65
-
66
-
67
-
68
-
69
-
70
-
71
-
72
-
73
-
74
-
75
-
76
-
77
-
78
-
79
-
80
-
81
-
82
-
83
-
84
-
85
-
86
-
87
-
88
-
89
-
90
-
91
-
92
-
93
-
94
-
95
-
96
-
97
-
98
-
99
-
100
-
101
-
102
-
103
-
104
-
105
-
106
-
107
-
108
-
109
-
110
-
111
-
112
-
113
-
114
-
115
-
116
-
117
-
118
-
119
-
120
-
121
-
122
-
123
-
124
-
125
-
126
-
127
-
128
-
129
-
130
-
131
-
132
-
133
-
134
-
135
-
136
-
137
-
138
-
139
-
140
-
141
-
142
-
143
-
144
-
145
-
146
-
147
-
148
-
149
-
150
-
151
-
152
-
153
-
154
-
155
-
156
-
157
-
158
-
159
-
160
-
161
-
162
-
163
-
164
-
165
-
166
-
167
-
168
-
169
-
170
-
171
-
172
-
173
-
174
-
175
-
176
-
177
-
178
-
179
-
180
-
 181
181 -
 182
182 -
 183
183 -
 184
184 -
 185
185 -
 186
186 -
 187
187 -
 188
188 -
 189
189 -
 190
190 -
 191
191 -
 192
192 -
 193
193 -
 194
194 -
 195
195 -
 196
196 -
 197
197 -
 198
198 -
 199
199 -
 200
200 -
 201
201 -
202
-
203
-
204
-
205
-
206
-
207
-
208
-
209
-
210
-
211
-
212
-
213
-
214
-
215
-
216
-
217
-
218
-
219
-
220
-
221
-
222
-
223
-
224
-
225
-
226
-
227
-
228
-
229
-
230
-
231
-
232
-
233
-
234
-
235
-
236
-
237
-
238
 |
 |
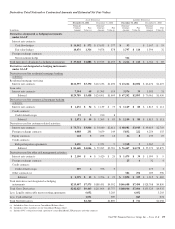
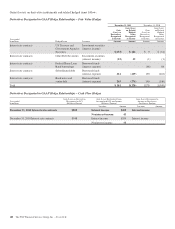
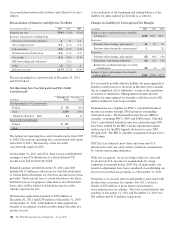
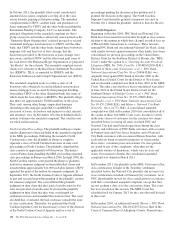
The notional amount of these credit default swaps by credit
rating follows:
Credit Ratings of Credit Default Swaps
Dollars in millions
December 31
2011
December 31
2010
Credit Default Swaps – Sold
Investment grade (a) $84 $220
Subinvestment grade (b) 10 14
Total $94 $234
Credit Default Swaps – Purchased
Investment grade (a) $145 $385
Subinvestment grade (b) 65 142
Total $210 $527
Total $304 $761
(a) Investment grade with a rating of BBB-/Baa3 or above based on published rating
agency information.
(b) Subinvestment grade with a rating below BBB-/Baa3 based on published rating
agency information.
The referenced/underlying assets for these credit default
swaps follow:
Referenced/Underlying Assets of Credit Default Swaps
Corporate
Debt
Commercial
mortgage-
backed
securities Loans
December 31, 2011 59% 20% 21%
December 31, 2010 62% 28% 10%
We enter into credit default swaps under which we buy loss
protection from or sell loss protection to a counterparty for the
occurrence of a credit event related to a referenced entity or
index. The maximum amount we would be required to pay
under the credit default swaps in which we sold protection,
assuming all referenced underlyings experience a credit event
at a total loss, without recoveries, was $94 million at
December 31, 2011 and $234 million at December 31, 2010.
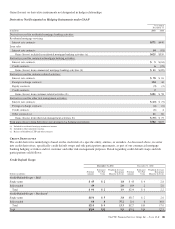
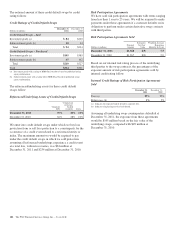
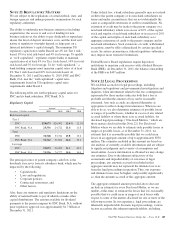
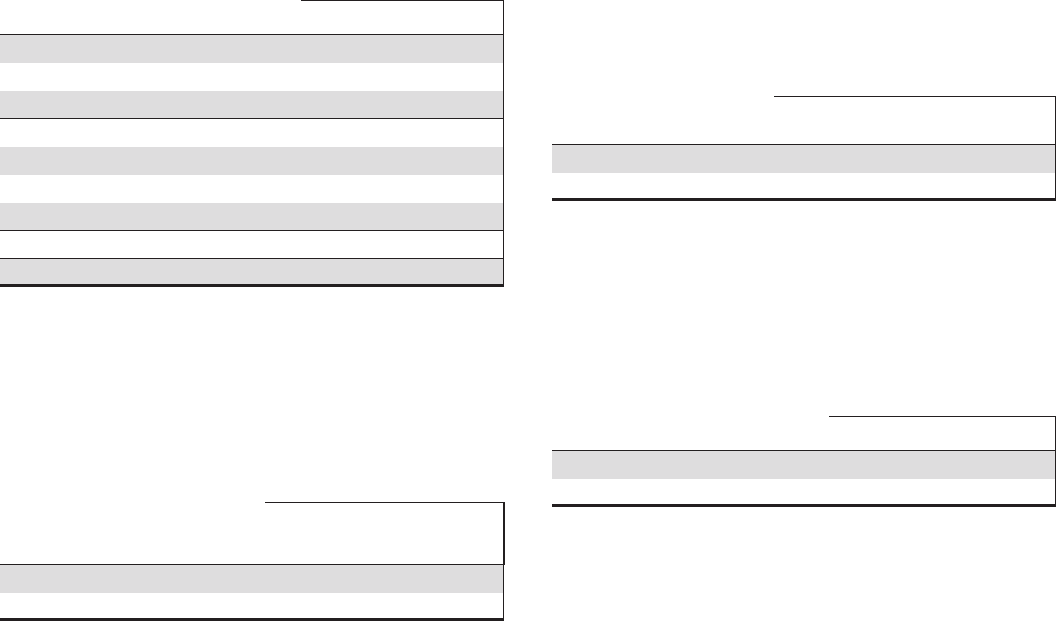
Risk Participation Agreements
We have sold risk participation agreements with terms ranging
from less than 1 year to 25 years. We will be required to make
payments under these agreements if a customer defaults on its
obligation to perform under certain derivative swap contracts
with third parties.
Risk Participation Agreements Sold
Dollars in millions
Notional
Amount
Estimated
Net Fair
Value
Weighted-Average
Remaining
Maturity In Years
December 31, 2011 $1,568 $(5) 7.5
December 31, 2010 $1,367 $(2) 2.0
Based on our internal risk rating process of the underlying
third parties to the swap contracts, the percentages of the
exposure amount of risk participation agreements sold by
internal credit rating follow:
Internal Credit Ratings of Risk Participation Agreements
Sold
December 31,
2011
December 31,
2010
Pass (a) 99% 95%
Below pass (b) 1% 5%
(a) Indicates the expected risk of default is currently low.
(b) Indicates a higher degree of risk of default.
Assuming all underlying swap counterparties defaulted at
December 31, 2011, the exposure from these agreements
would be $145 million based on the fair value of the
underlying swaps, compared with $49 million at
December 31, 2010.
182 The PNC Financial Services Group, Inc. – Form 10-K