PNC Bank 2011 Annual Report Download - page 92
Download and view the complete annual report
Please find page 92 of the 2011 PNC Bank annual report below. You can navigate through the pages in the report by either clicking on the pages listed below, or by using the keyword search tool below to find specific information within the annual report.-
 1
1 -
2
-
3
-
4
-
5
-
6
-
7
-
8
-
9
-
10
-
11
-
12
-
13
-
14
-
15
-
16
-
17
-
18
-
19
-
20
-
21
-
22
-
23
-
24
-
25
-
26
-
27
-
28
-
29
-
30
-
31
-
32
-
33
-
34
-
35
-
36
-
37
-
38
-
39
-
40
-
41
-
42
-
43
-
44
-
45
-
46
-
47
-
48
-
49
-
50
-
51
-
52
-
53
-
54
-
55
-
56
-
57
-
58
-
59
-
60
-
61
-
62
-
63
-
64
-
65
-
66
-
67
-
68
-
69
-
70
-
71
-
72
-
73
-
74
-
75
-
76
-
77
-
78
-
79
-
80
-
81
-
 82
82 -
 83
83 -
 84
84 -
 85
85 -
 86
86 -
 87
87 -
 88
88 -
 89
89 -
 90
90 -
 91
91 -
 92
92 -
 93
93 -
 94
94 -
 95
95 -
 96
96 -
 97
97 -
 98
98 -
 99
99 -
 100
100 -
 101
101 -
 102
102 -
103
-
104
-
105
-
106
-
107
-
108
-
109
-
110
-
111
-
112
-
113
-
114
-
115
-
116
-
117
-
118
-
119
-
120
-
121
-
122
-
123
-
124
-
125
-
126
-
127
-
128
-
129
-
130
-
131
-
132
-
133
-
134
-
135
-
136
-
137
-
138
-
139
-
140
-
141
-
142
-
143
-
144
-
145
-
146
-
147
-
148
-
149
-
150
-
151
-
152
-
153
-
154
-
155
-
156
-
157
-
158
-
159
-
160
-
161
-
162
-
163
-
164
-
165
-
166
-
167
-
168
-
169
-
170
-
171
-
172
-
173
-
174
-
175
-
176
-
177
-
178
-
179
-
180
-
181
-
182
-
183
-
184
-
185
-
186
-
187
-
188
-
189
-
190
-
191
-
192
-
193
-
194
-
195
-
196
-
197
-
198
-
199
-
200
-
201
-
202
-
203
-
204
-
205
-
206
-
207
-
208
-
209
-
210
-
211
-
212
-
213
-
214
-
215
-
216
-
217
-
218
-
219
-
220
-
221
-
222
-
223
-
224
-
225
-
226
-
227
-
228
-
229
-
230
-
231
-
232
-
233
-
234
-
235
-
236
-
237
-
238
 |
 |
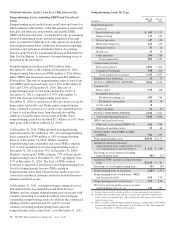
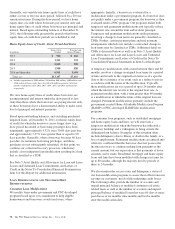
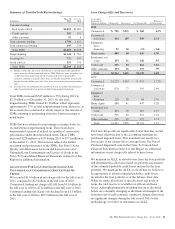
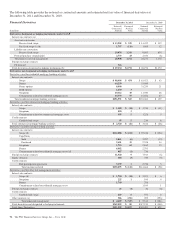
At December 31, 2011, total ALLL to total nonperforming
loans was 122%. The comparable amount for December 31,
2010 was 109%. The allowance allocated to consumer loans
and lines of credit not secured by residential real estate and
purchased impaired loans, which are both excluded from
nonperforming loans, totaled $1.4 billion at both
December 31, 2011, and 2010. See the Nonperforming Assets
By Type table within this Credit Risk Management section for
additional information. Excluding these balances, the
allowance as a percent of nonperforming loans was 84% and
77% as of December 31, 2011 and December 31, 2010,
respectively.
See Note 5 Asset Quality and Allowances for Loan and Lease
Losses and Unfunded Loan Commitments and Letters of
Credit and Note 6 Purchased Impaired Loans in the Notes To
Consolidated Financial Statements in Item 8 of this Report
regarding changes in the ALLL and in the allowance for
unfunded loan commitments and letters of credit.
C
REDIT
D
EFAULT
S
WAPS
From a credit risk management perspective, we use credit
default swaps (CDS) as a tool to manage risk concentrations
in the credit portfolio. That risk management could come from
protection purchased or sold in the form of single name or
index products. When we buy loss protection by purchasing a
CDS, we pay a fee to the seller, or CDS counterparty, in return
for the right to receive a payment if a specified credit event
occurs for a particular obligor or reference entity.
When we sell protection, we receive a CDS premium from the
buyer in return for PNC’s obligation to pay the buyer if a
specified credit event occurs for a particular obligor or
reference entity.
We evaluate the counterparty credit worthiness for all our
CDS activities. Counterparty credit lines are approved based
on a review of credit quality in accordance with our traditional
credit quality standards and credit policies. The credit risk of
our counterparties is monitored in the normal course of
business. In addition, all counterparty credit lines are subject
to collateral thresholds and exposures above these thresholds
are secured.
CDSs are included in the “Derivatives not designated as
hedging instruments under GAAP” table in the Financial
Derivatives section of this Risk Management discussion.
O
PERATIONAL
R
ISK
M
ANAGEMENT
Operational risk is the risk of loss resulting from inadequate or
failed internal processes or systems, human factors, or
external events. This includes losses that may arise as a result
of non-compliance with laws or regulations, failure to fulfill
fiduciary responsibilities, as well as litigation or other legal
actions. Operational risk may occur in any of our business
activities and manifests itself in various ways, including but
not limited to:
• Transaction processing errors,
• Unauthorized transactions and fraud by employees or
third parties,
• Material disruption in business activities,
• System breaches and misuse of sensitive information,
• Regulatory or governmental actions, fines or
penalties, and
• Significant legal expenses, judgments or settlements.
Operational Risk Management focuses on balancing business
needs, regulatory expectations and risk management priorities
through a balanced, adaptive and proactive program that is
designed to provide a strong governance model, sound and
consistent management processes and transparent operational
risk reporting across the enterprise.
We manage operational risk based upon a comprehensive
framework that enables the company to determine the
enterprise and individual business unit’s operational risk
profile in comparison to the established risk appetite and
identify operational risks that may require further mitigation.
This framework is established around a set of enterprise-wide
policies and a system of internal controls that are designed to
manage risk and to provide management with timely and
accurate information about the operations of PNC. This
framework employs a number of techniques to manage
operational risk, including:
• Risk and Control Self-Assessments (RCSAs) are
performed at least annually across PNC’s businesses,
processes, systems and products. RCSA methodology
is a standard process for management to self assess
operational risks, evaluate control effectiveness, and
determine if risk exposure is within established
tolerances;
• Scenario Analysis is leveraged to proactively
evaluate operational loss events with the potential for
severe business, financial, operational or regulatory
impact on the company or a major business unit. This
methodology leverages standard processes and tools
to evaluate a wide range of business and operational
risks encompassing both external and internal events
relevant to the company. Based upon scenario
analysis conclusions, management may implement
additional controls or risk management activities to
reduce exposure to an acceptable level;
• A Key Risk Indicator (KRI) framework allows
management to assess actual operational risk results
compared to expectations and thresholds, as well as
proactively identify unexpected shifts in operational
risk exposure or control effectiveness. Enterprise-
level KRIs are designed to monitor exposure across
the different inherent operational risk types.
Business-specific KRIs are established in support of
the individual risk and control self assessments; and
• Operational loss events across the enterprise are
continuously captured and maintained in a central
repository. This information is analyzed and used to
help determine the root causes of these events and to
identify trends that could indicate changes in the
company’s risk exposure or control effectiveness.
The PNC Financial Services Group, Inc. – Form 10-K 83