PNC Bank 2011 Annual Report Download - page 71
Download and view the complete annual report
Please find page 71 of the 2011 PNC Bank annual report below. You can navigate through the pages in the report by either clicking on the pages listed below, or by using the keyword search tool below to find specific information within the annual report.-
 1
1 -
2
-
3
-
4
-
5
-
6
-
7
-
8
-
9
-
10
-
11
-
12
-
13
-
14
-
15
-
16
-
17
-
18
-
19
-
20
-
21
-
22
-
23
-
24
-
25
-
26
-
27
-
28
-
29
-
30
-
31
-
32
-
33
-
34
-
35
-
36
-
37
-
38
-
39
-
40
-
41
-
42
-
43
-
44
-
45
-
46
-
47
-
48
-
49
-
50
-
51
-
52
-
53
-
54
-
55
-
56
-
57
-
58
-
59
-
60
-
 61
61 -
 62
62 -
 63
63 -
 64
64 -
 65
65 -
 66
66 -
 67
67 -
 68
68 -
 69
69 -
 70
70 -
 71
71 -
 72
72 -
 73
73 -
 74
74 -
 75
75 -
 76
76 -
 77
77 -
 78
78 -
 79
79 -
 80
80 -
 81
81 -
82
-
83
-
84
-
85
-
86
-
87
-
88
-
89
-
90
-
91
-
92
-
93
-
94
-
95
-
96
-
97
-
98
-
99
-
100
-
101
-
102
-
103
-
104
-
105
-
106
-
107
-
108
-
109
-
110
-
111
-
112
-
113
-
114
-
115
-
116
-
117
-
118
-
119
-
120
-
121
-
122
-
123
-
124
-
125
-
126
-
127
-
128
-
129
-
130
-
131
-
132
-
133
-
134
-
135
-
136
-
137
-
138
-
139
-
140
-
141
-
142
-
143
-
144
-
145
-
146
-
147
-
148
-
149
-
150
-
151
-
152
-
153
-
154
-
155
-
156
-
157
-
158
-
159
-
160
-
161
-
162
-
163
-
164
-
165
-
166
-
167
-
168
-
169
-
170
-
171
-
172
-
173
-
174
-
175
-
176
-
177
-
178
-
179
-
180
-
181
-
182
-
183
-
184
-
185
-
186
-
187
-
188
-
189
-
190
-
191
-
192
-
193
-
194
-
195
-
196
-
197
-
198
-
199
-
200
-
201
-
202
-
203
-
204
-
205
-
206
-
207
-
208
-
209
-
210
-
211
-
212
-
213
-
214
-
215
-
216
-
217
-
218
-
219
-
220
-
221
-
222
-
223
-
224
-
225
-
226
-
227
-
228
-
229
-
230
-
231
-
232
-
233
-
234
-
235
-
236
-
237
-
238
 |
 |
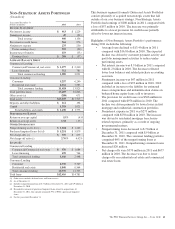
The majority of assets within this portfolio were obtained
through acquisitions and fall outside of our core business
strategy. Consequently, the business activity of this segment is
to manage the wind-down of the portfolio assigned to it while
maximizing the value and mitigating risk. The fair value
marks taken upon acquisition of the assets, the team we have
in place, and targeted asset resolution strategies help us to
manage these assets. Additionally, our capital and liquidity
positions provide us flexibility in a challenging environment
to optimize returns on this portfolio for our shareholders.
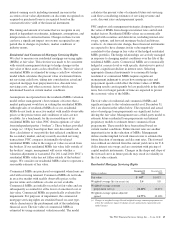
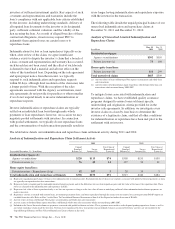
• The $12.4 billion of loans held in this portfolio at
December 31, 2011 are stated inclusive of a fair
value adjustment on purchased impaired loans at
acquisition. Taking the adjustment and the ALLL
into account, the net carrying basis of this loan
portfolio is 79% of customer outstandings.
• The Commercial Lending portfolio within this
segment is comprised of $1.0 billion in residential
development loans (i.e. condominiums, townhomes,
developed and undeveloped land) and $.7 billion of
performing cross-border leases. This portfolio has
been reduced by 33% since December 31, 2010
driven by the decline in residential development
loans. The cross-border lease portfolio has been
relatively stable. These assets are long-term and are
of high credit quality.
• The performance of the Consumer Lending portfolio
within this segment is dependent upon economic
growth, unemployment rates, the housing market
recovery and the interest rate environment. The
portfolio’s credit quality performance has stabilized
through actions taken by management over the last
three years. Approximately 76% of customers have
been current with principal and interest payments for
the past 12 months. Consumer Lending consists of
consumer loans, which are mainly brokered home
equity loans and lines of credit, and residential real
estate mortgages. The residential real estate mortgage
portfolio is composed of jumbo and ALT-A first lien
mortgages, non-prime first and second lien
mortgages and, to a lesser extent, residential
construction loans. Management has implemented
various refinance programs, line management
programs, and loss mitigation programs to mitigate
risks within these portfolios while assisting
borrowers to maintain homeownership when
possible.
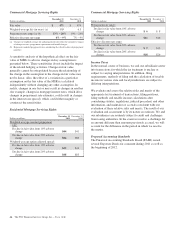
• When loans are sold, we may assume certain loan
repurchase obligations associated with those loans
primarily relating to situations where investors may
request PNC to indemnify them against losses or to
repurchase loans that they believe do not comply
with applicable contractual loan origination
covenants and representations and warranties we
have made. From 2005 to 2007, home equity loans
were sold with such contractual provisions. At
December 31, 2011, the liability for estimated losses
on repurchase and indemnification claims for the
Non-Strategic Assets Portfolio business segment was
$47 million. No substantial additional reserves were
recorded in 2011. See the Recourse And Repurchase
Obligations section of this Item 7 and Note 23
Commitments and Guarantees in the Notes To
Consolidated Financial Statements included in Item 8
of this Report for additional information.
C
RITICAL
A
CCOUNTING
E
STIMATES
A
ND
J
UDGMENTS
Our consolidated financial statements are prepared by
applying certain accounting policies. Note 1 Accounting
Policies in the Notes To Consolidated Financial Statements in
Item 8 of this Report describes the most significant accounting
policies that we use. Certain of these policies require us to
make estimates or economic assumptions that may vary under
different assumptions or conditions and such variations may
significantly affect our reported results and financial position
for the period or in future periods.
Fair Value Measurements
We must use estimates, assumptions, and judgments when
assets and liabilities are required to be recorded at, or adjusted
to reflect, fair value.
Assets and liabilities carried at fair value inherently result in a
higher degree of financial statement volatility. Fair values and
the information used to record valuation adjustments for
certain assets and liabilities are based on either quoted market
prices or are provided by independent third-party sources,
including appraisers and valuation specialists, when available.
When such third-party information is not available, we
estimate fair value primarily by using cash flow and other
financial modeling techniques. Changes in underlying factors,
assumptions, or estimates in any of these areas could
materially impact our future financial condition and results of
operations.
PNC applies Fair Value Measurements and Disclosures (ASC
820). This guidance defines fair value as the price that would
be received to sell a financial asset or paid to transfer a
financial liability in an orderly transaction between market
participants at the measurement date. This guidance requires a
three level hierarchy for disclosure of assets and liabilities
recorded at fair value. The classification of assets and
liabilities within the hierarchy is based on whether the inputs
to the valuation methodology used in the measurement are
observable or unobservable.
62 The PNC Financial Services Group, Inc. – Form 10-K