PNC Bank 2011 Annual Report Download - page 98
Download and view the complete annual report
Please find page 98 of the 2011 PNC Bank annual report below. You can navigate through the pages in the report by either clicking on the pages listed below, or by using the keyword search tool below to find specific information within the annual report.-
 1
1 -
2
-
3
-
4
-
5
-
6
-
7
-
8
-
9
-
10
-
11
-
12
-
13
-
14
-
15
-
16
-
17
-
18
-
19
-
20
-
21
-
22
-
23
-
24
-
25
-
26
-
27
-
28
-
29
-
30
-
31
-
32
-
33
-
34
-
35
-
36
-
37
-
38
-
39
-
40
-
41
-
42
-
43
-
44
-
45
-
46
-
47
-
48
-
49
-
50
-
51
-
52
-
53
-
54
-
55
-
56
-
57
-
58
-
59
-
60
-
61
-
62
-
63
-
64
-
65
-
66
-
67
-
68
-
69
-
70
-
71
-
72
-
73
-
74
-
75
-
76
-
77
-
78
-
79
-
80
-
81
-
82
-
83
-
84
-
85
-
86
-
87
-
 88
88 -
 89
89 -
 90
90 -
 91
91 -
 92
92 -
 93
93 -
 94
94 -
 95
95 -
 96
96 -
 97
97 -
 98
98 -
 99
99 -
 100
100 -
 101
101 -
 102
102 -
 103
103 -
 104
104 -
 105
105 -
 106
106 -
 107
107 -
 108
108 -
109
-
110
-
111
-
112
-
113
-
114
-
115
-
116
-
117
-
118
-
119
-
120
-
121
-
122
-
123
-
124
-
125
-
126
-
127
-
128
-
129
-
130
-
131
-
132
-
133
-
134
-
135
-
136
-
137
-
138
-
139
-
140
-
141
-
142
-
143
-
144
-
145
-
146
-
147
-
148
-
149
-
150
-
151
-
152
-
153
-
154
-
155
-
156
-
157
-
158
-
159
-
160
-
161
-
162
-
163
-
164
-
165
-
166
-
167
-
168
-
169
-
170
-
171
-
172
-
173
-
174
-
175
-
176
-
177
-
178
-
179
-
180
-
181
-
182
-
183
-
184
-
185
-
186
-
187
-
188
-
189
-
190
-
191
-
192
-
193
-
194
-
195
-
196
-
197
-
198
-
199
-
200
-
201
-
202
-
203
-
204
-
205
-
206
-
207
-
208
-
209
-
210
-
211
-
212
-
213
-
214
-
215
-
216
-
217
-
218
-
219
-
220
-
221
-
222
-
223
-
224
-
225
-
226
-
227
-
228
-
229
-
230
-
231
-
232
-
233
-
234
-
235
-
236
-
237
-
238
 |
 |
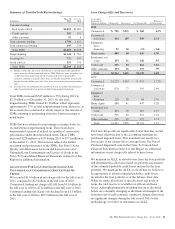
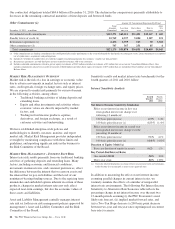
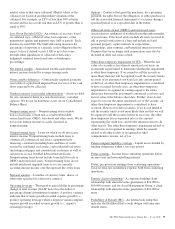
Net Interest Income Sensitivity to Alternative Rate Scenarios
(Fourth Quarter 2011)
PNC
Economist
Market
Forward
Two-Ten
Slope
First year sensitivity .9% .8% .4%
Second year sensitivity 4.1% 3.1% .9%
All changes in forecasted net interest income are relative to
results in a base rate scenario where current market rates are
assumed to remain unchanged over the forecast horizon.
When forecasting net interest income, we make assumptions
about interest rates and the shape of the yield curve, the
volume and characteristics of new business, and the behavior
of existing on- and off-balance sheet positions. These
assumptions determine the future level of simulated net
interest income in the base interest rate scenario and the other
interest rate scenarios presented in the above table. These
simulations assume that as assets and liabilities mature, they
are replaced or repriced at then current market rates. We also
consider forward projections of purchase accounting accretion
when forecasting net interest income.
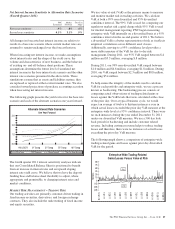
The following graph presents the yield curves for the base rate
scenario and each of the alternate scenarios one year forward.
Alternate Interest Rate Scenarios
One Year Forward
0.0
1.0
2.0
3.0
1M LIBOR 2Y Swap 3Y Swap 5Y Swap 10Y Swap
Base Rates PNC Economist Market Forward Two-Ten Slope decrease
The fourth quarter 2011 interest sensitivity analyses indicate
that our Consolidated Balance Sheet is positioned to benefit
from an increase in interest rates and an upward sloping
interest rate yield curve. We believe that we have the deposit
funding base and balance sheet flexibility to adjust, where
appropriate and permissible, to changing interest rates and
market conditions.
M
ARKET
R
ISK
M
ANAGEMENT
–T
RADING
R
ISK
Our trading activities are primarily customer-driven trading in
fixed income securities, derivatives, and foreign exchange
contracts. They also include the underwriting of fixed income
and equity securities.
We use value-at-risk (VaR) as the primary means to measure
and monitor market risk in trading activities. We calculate
VaR at both a 99% non diversified and 95% diversified
confidence interval. The 99% VaR is used for computing our
regulatory market risk capital charge while 95% VaR is used
for internal management reporting. PNC began measuring
enterprise wide VaR internally on a diversified basis at a 95%
confidence interval in the second quarter of 2011. We believe
a diversified VaR is a better representation of risk as it reflects
empirical correlations across different asset classes.
Additionally, moving to a 95% confidence level provides a
more stable measure of the VaR for day-to-day risk
management. During 2011, our 95% VaR ranged between $.4
million and $3.5 million, averaging $.8 million.
During 2011, our 99% non-diversified VaR ranged between
$1.0 million and $6.8 million, averaging $1.8 million. During
2010, our VaR ranged between $2.3 million and $8.8 million,
averaging $5.4 million.
To help ensure the integrity of the models used to calculate
VaR for each portfolio and enterprise-wide, we use a process
known as backtesting. The backtesting process consists of
comparing actual observations of trading-related gains or
losses against the VaR levels that were calculated at the close
of the prior day. Over a typical business cycle, we would
expect an average of twelve to thirteen instances a year in
which actual losses exceeded the prior day VaR measure at the
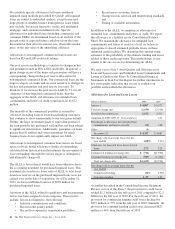
enterprise-wide level at a 95% confidence interval. There were
no such instances during the year ended December 31, 2011
under our diversified VaR measure. We use a 500 day look
back period for backtesting and include customer related
revenue. Including customer revenue helps to reduce trading
losses and therefore, there were no instances of actual losses
exceeding the prior day VaR measure.
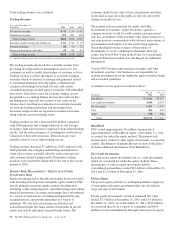
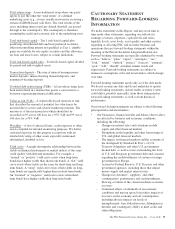
The following graph shows a comparison of enterprise-wide
trading-related gains and losses against prior day diversified
VaR for the period.
Enterprise-Wide Trading-Related
Gains/Losses Versus Value at Risk
(45)
(30)
(15)
0
15
30
45
60
90
75
12/31/10
1/31/11
2/28/11
3/31/11
4/30/11
5/31/11
6/30/11
7/31/11
8/31/11
9/30/11
10/31/11
11/30/11
12/30/11
Millions
VaR
P&L
The PNC Financial Services Group, Inc. – Form 10-K 89