PNC Bank 2011 Annual Report Download - page 217
Download and view the complete annual report
Please find page 217 of the 2011 PNC Bank annual report below. You can navigate through the pages in the report by either clicking on the pages listed below, or by using the keyword search tool below to find specific information within the annual report.-
 1
1 -
2
-
3
-
4
-
5
-
6
-
7
-
8
-
9
-
10
-
11
-
12
-
13
-
14
-
15
-
16
-
17
-
18
-
19
-
20
-
21
-
22
-
23
-
24
-
25
-
26
-
27
-
28
-
29
-
30
-
31
-
32
-
33
-
34
-
35
-
36
-
37
-
38
-
39
-
40
-
41
-
42
-
43
-
44
-
45
-
46
-
47
-
48
-
49
-
50
-
51
-
52
-
53
-
54
-
55
-
56
-
57
-
58
-
59
-
60
-
61
-
62
-
63
-
64
-
65
-
66
-
67
-
68
-
69
-
70
-
71
-
72
-
73
-
74
-
75
-
76
-
77
-
78
-
79
-
80
-
81
-
82
-
83
-
84
-
85
-
86
-
87
-
88
-
89
-
90
-
91
-
92
-
93
-
94
-
95
-
96
-
97
-
98
-
99
-
100
-
101
-
102
-
103
-
104
-
105
-
106
-
107
-
108
-
109
-
110
-
111
-
112
-
113
-
114
-
115
-
116
-
117
-
118
-
119
-
120
-
121
-
122
-
123
-
124
-
125
-
126
-
127
-
128
-
129
-
130
-
131
-
132
-
133
-
134
-
135
-
136
-
137
-
138
-
139
-
140
-
141
-
142
-
143
-
144
-
145
-
146
-
147
-
148
-
149
-
150
-
151
-
152
-
153
-
154
-
155
-
156
-
157
-
158
-
159
-
160
-
161
-
162
-
163
-
164
-
165
-
166
-
167
-
168
-
169
-
170
-
171
-
172
-
173
-
174
-
175
-
176
-
177
-
178
-
179
-
180
-
181
-
182
-
183
-
184
-
185
-
186
-
187
-
188
-
189
-
190
-
191
-
192
-
193
-
194
-
195
-
196
-
197
-
198
-
199
-
200
-
201
-
202
-
203
-
204
-
205
-
206
-
 207
207 -
 208
208 -
 209
209 -
 210
210 -
 211
211 -
 212
212 -
 213
213 -
 214
214 -
 215
215 -
 216
216 -
 217
217 -
 218
218 -
 219
219 -
 220
220 -
 221
221 -
 222
222 -
 223
223 -
 224
224 -
 225
225 -
 226
226 -
 227
227 -
228
-
229
-
230
-
231
-
232
-
233
-
234
-
235
-
236
-
237
-
238
 |
 |

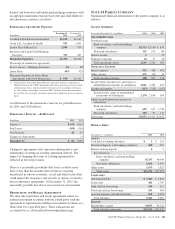
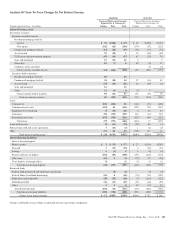
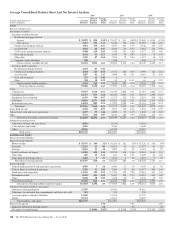
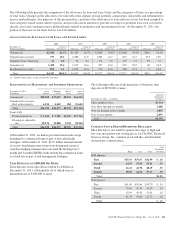
Average Consolidated Balance Sheet And Net Interest Analysis
2011 2010 2009
Taxable-equivalent basis
Dollars in millions
Average
Balances
Interest
Income/
Expense
Average
Yields/
Rates
Average
Balances
Interest
Income/
Expense
Average
Yields/
Rates
Average
Balances
Interest
Income/
Expense
Average
Yields/
Rates
Assets
Interest-earning assets:
Investment securities
Securities available for sale
Residential mortgage-backed
Agency $ 25,892 $ 894 3.45% $ 23,437 $ 911 3.89% $ 21,889 $ 1,038 4.74%
Non-agency 7,413 394 5.31 9,240 558 6.04 11,993 780 6.50
Commercial mortgage-backed 3,461 158 4.57 3,679 191 5.19 4,748 264 5.56
Asset-backed 3,402 84 2.47 2,240 83 3.71 1,963 145 7.39
US Treasury and government agencies 4,308 114 2.65 7,549 211 2.80 4,477 137 3.06
State and municipal 2,002 91 4.55 1,445 79 5.47 1,354 74 5.47
Other debt 3,350 87 2.60 2,783 79 2.84 1,327 46 3.47
Corporate stocks and other 428 448 398 3 .75
Total securities available for sale 50,256 1,822 3.63 50,821 2,112 4.16 48,149 2,487 5.17
Securities held to maturity
Residential mortgage-backed 2,424 83 3.42
Commercial mortgage-backed 4,444 220 4.95 3,711 206 5.55 1,990 123 6.18
Asset-backed 1,985 43 2.17 3,409 89 2.61 2,085 93 4.46
State and municipal 271 12 4.43 88
Other 308 10 3.25 41 6 14.63 63 6 9.52
Total securities held to maturity 9,432 368 3.90 7,169 301 4.20 4,146 222 5.35
Total investment securities 59,688 2,190 3.67 57,990 2,413 4.16 52,295 2,709 5.18
Loans
Commercial 59,437 2,924 4.92 54,339 2,888 5.31 61,183 3,288 5.37
Commercial real estate 16,767 879 5.24 20,435 1,045 5.11 24,775 1,292 5.21
Equipment lease financing 6,219 309 4.97 6,276 325 5.18 6,201 298 4.81
Consumer 54,669 2,673 4.89 55,015 2,865 5.21 52,368 2,745 5.24
Residential real estate 14,924 883 5.92 17,709 1,209 6.83 21,116 1,336 6.33
Total loans 152,016 7,668 5.04 153,774 8,332 5.42 165,643 8,959 5.41
Loans held for sale 2,768 193 6.97 2,871 263 9.16 3,976 270 6.79
Federal funds sold and resale agreements 2,297 33 1.44 1,899 37 1.95 1,865 42 2.25
Other 7,571 214 2.83 8,215 185 2.25 14,708 174 1.18
Total interest-earning assets/interest income 224,340 10,298 4.59 224,749 11,230 5.00 238,487 12,154 5.10
Noninterest-earning assets:
Allowance for loan and lease losses (4,656) (5,144) (4,316)
Cash and due from banks 3,565 3,569 3,648
Other 42,086 41,728 39,057
Total assets $265,335 $264,902 $276,876
Liabilities and Equity
Interest-bearing liabilities:
Interest-bearing deposits
Money market $ 58,765 $ 184 .31% $ 58,264 $ 261 .45% $ 55,326 $ 548 .99%
Demand 27,563 23 .08 25,025 33 .13 23,477 67 .29
Savings 8,185 15 .18 7,005 13 .19 6,495 14 .22
Retail certificates of deposit 34,009 428 1.26 42,933 628 1.46 54,584 1,043 1.91
Other time 405 13 3.21 813 22 2.71 5,009 60 1.20
Time deposits in foreign offices 2,410 5 .21 2,785 6 .22 3,637 9 .25
Total interest-bearing deposits 131,337 668 .51 136,825 963 .70 148,528 1,741 1.17
Borrowed funds
Federal funds purchased and repurchase agreements 4,469 7 .16 4,309 13 .30 4,439 16 .36
Federal Home Loan Bank borrowings 5,305 53 1.00 7,996 71 .89 14,177 200 1.41
Bank notes and senior debt 11,202 252 2.25 12,790 320 2.50 12,981 443 3.41
Subordinated debt 8,942 456 5.10 9,647 505 5.23 10,191 600 5.89
Other 5,808 58 1.00 5,438 50 .92 2,345 35 1.49
Total borrowed funds 35,726 826 2.31 40,180 959 2.39 44,133 1,294 2.93
Total interest-bearing liabilities/interest expense 167,063 1,494 .89 177,005 1,922 1.09 192,661 3,035 1.58
Noninterest-bearing liabilities and equity:
Noninterest-bearing deposits 51,707 45,076 41,416
Allowance for unfunded loan commitments and letters of credit 203 239 328
Accrued expenses and other liabilities 11,040 11,015 12,179
Equity 35,322 31,567 30,292
Total liabilities and equity $265,335 $264,902 $276,876
Interest rate spread 3.70 3.91 3.52
Impact of noninterest-bearing sources .22 .23 .30
Net interest income/margin $ 8,804 3.92% $ 9,308 4.14% $ 9,119 3.82%
208 The PNC Financial Services Group, Inc. – Form 10-K