PNC Bank 2011 Annual Report Download - page 149
Download and view the complete annual report
Please find page 149 of the 2011 PNC Bank annual report below. You can navigate through the pages in the report by either clicking on the pages listed below, or by using the keyword search tool below to find specific information within the annual report.-
 1
1 -
2
-
3
-
4
-
5
-
6
-
7
-
8
-
9
-
10
-
11
-
12
-
13
-
14
-
15
-
16
-
17
-
18
-
19
-
20
-
21
-
22
-
23
-
24
-
25
-
26
-
27
-
28
-
29
-
30
-
31
-
32
-
33
-
34
-
35
-
36
-
37
-
38
-
39
-
40
-
41
-
42
-
43
-
44
-
45
-
46
-
47
-
48
-
49
-
50
-
51
-
52
-
53
-
54
-
55
-
56
-
57
-
58
-
59
-
60
-
61
-
62
-
63
-
64
-
65
-
66
-
67
-
68
-
69
-
70
-
71
-
72
-
73
-
74
-
75
-
76
-
77
-
78
-
79
-
80
-
81
-
82
-
83
-
84
-
85
-
86
-
87
-
88
-
89
-
90
-
91
-
92
-
93
-
94
-
95
-
96
-
97
-
98
-
99
-
100
-
101
-
102
-
103
-
104
-
105
-
106
-
107
-
108
-
109
-
110
-
111
-
112
-
113
-
114
-
115
-
116
-
117
-
118
-
119
-
120
-
121
-
122
-
123
-
124
-
125
-
126
-
127
-
128
-
129
-
130
-
131
-
132
-
133
-
134
-
135
-
136
-
137
-
138
-
 139
139 -
 140
140 -
 141
141 -
 142
142 -
 143
143 -
 144
144 -
 145
145 -
 146
146 -
 147
147 -
 148
148 -
 149
149 -
 150
150 -
 151
151 -
 152
152 -
 153
153 -
 154
154 -
 155
155 -
 156
156 -
 157
157 -
 158
158 -
 159
159 -
160
-
161
-
162
-
163
-
164
-
165
-
166
-
167
-
168
-
169
-
170
-
171
-
172
-
173
-
174
-
175
-
176
-
177
-
178
-
179
-
180
-
181
-
182
-
183
-
184
-
185
-
186
-
187
-
188
-
189
-
190
-
191
-
192
-
193
-
194
-
195
-
196
-
197
-
198
-
199
-
200
-
201
-
202
-
203
-
204
-
205
-
206
-
207
-
208
-
209
-
210
-
211
-
212
-
213
-
214
-
215
-
216
-
217
-
218
-
219
-
220
-
221
-
222
-
223
-
224
-
225
-
226
-
227
-
228
-
229
-
230
-
231
-
232
-
233
-
234
-
235
-
236
-
237
-
238
 |
 |

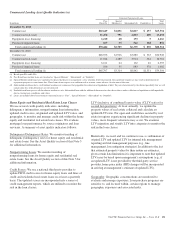
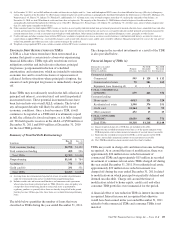
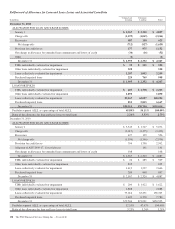
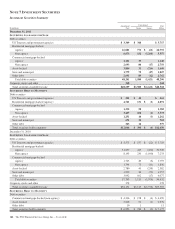
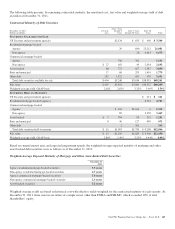
Impaired Loans
In millions
Unpaid
Principal
Balance
Recorded
Investment (a)
Associated
Allowance (b)
Average
Recorded
Investment (a)
December 31, 2011
Impaired loans with an associated allowance
Commercial $1,125 $ 785 $ 241 $ 979
Commercial real estate 1,452 1,043 318 1,247
Home equity 774 762 292 702
Residential real estate 853 730 193 609
Credit card 258 258 53 281
Other consumer 48 48 3 39
Total impaired loans with an associated allowance $4,510 $3,626 $1,100 $3,857
Impaired loans without an associated allowance
Commercial $ 347 $ 125 $ 104
Commercial real estate 592 342 413
Total impaired loans without an associated allowance $ 939 $ 467 $ 517
Total impaired loans $5,449 $4,093 $1,100 $4,374
December 31, 2010
Impaired loans with an associated allowance
Commercial $1,769 $1,178 $ 410 $1,533
Commercial real estate 1,927 1,446 449 1,732
Home equity 622 622 207 448
Residential real estate 521 465 122 309
Credit card 301 301 149 275
Other consumer 34 34 7 30
Total impaired loans with an associated allowance $5,174 $4,046 $1,344 $4,327
Impaired loans without an associated allowance
Commercial $ 87 $ 75 $ 90
Commercial real estate 525 389 320
Total impaired loans without an associated allowance $ 612 $ 464 $ 410
Total impaired loans $5,786 $4,510 $1,344 $4,737
(a) Recorded investment in a loan includes the unpaid principal balance plus accrued interest and net accounting adjustments, less any charge-offs. Recorded investment does not include
any associated valuation allowance. Average recorded investment is for the years ended December 31, 2011 and December 31, 2010 and is a simple average calculation using
quarter-end balances.
(b) Associated allowance amounts include $580 million and $509 million for TDRs at December 31, 2011 and December 31, 2010, respectively.
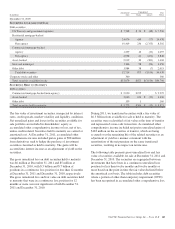
A
LLOWANCE FOR
U
NFUNDED
L
OAN
C
OMMITMENTS AND
L
ETTERS OF
C
REDIT
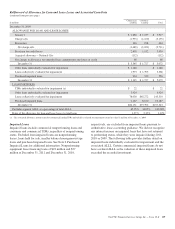
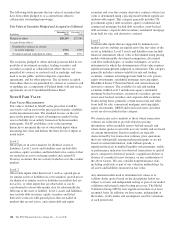
We maintain the allowance for unfunded loan commitments
and letters of credit at a level we believe is appropriate to
absorb estimated probable credit losses on these unfunded
credit facilities. See Note 1 Accounting Policies for additional
information.
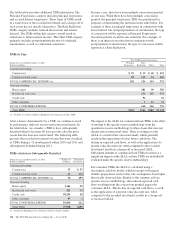
Rollforward of Allowance for Unfunded Loan Commitments
and Letters of Credit
In millions 2011 2010 2009
January 1 $188 $296 $344
Net change in allowance for unfunded loan
commitments and letters of credit 52 (108) (48)
December 31 $240 $188 $296
N
OTE
6P
URCHASED
I
MPAIRED
L
OANS
At December 31, 2008, we identified certain loans related to the
National City acquisition, for which there was evidence of credit
quality deterioration since origination and it was probable that we
would be unable to collect all contractually required principal and
interest payments. Evidence of credit quality deterioration
included statistics such as past due status, declines in updated
borrower FICO credit scores, geographic concentration and
increases in updated LTV ratios. GAAP requires these loans to be
recorded at fair value at acquisition date and prohibits the
“carrying over” or the creation of valuation allowances in the
initial accounting for such loans acquired in a transfer.
GAAP allows purchasers to aggregate purchased impaired loans
acquired in the same fiscal quarter into one or more pools,
provided that the loans have common risk characteristics. A
140 The PNC Financial Services Group, Inc. – Form 10-K