PNC Bank 2011 Annual Report Download - page 196
Download and view the complete annual report
Please find page 196 of the 2011 PNC Bank annual report below. You can navigate through the pages in the report by either clicking on the pages listed below, or by using the keyword search tool below to find specific information within the annual report.-
 1
1 -
2
-
3
-
4
-
5
-
6
-
7
-
8
-
9
-
10
-
11
-
12
-
13
-
14
-
15
-
16
-
17
-
18
-
19
-
20
-
21
-
22
-
23
-
24
-
25
-
26
-
27
-
28
-
29
-
30
-
31
-
32
-
33
-
34
-
35
-
36
-
37
-
38
-
39
-
40
-
41
-
42
-
43
-
44
-
45
-
46
-
47
-
48
-
49
-
50
-
51
-
52
-
53
-
54
-
55
-
56
-
57
-
58
-
59
-
60
-
61
-
62
-
63
-
64
-
65
-
66
-
67
-
68
-
69
-
70
-
71
-
72
-
73
-
74
-
75
-
76
-
77
-
78
-
79
-
80
-
81
-
82
-
83
-
84
-
85
-
86
-
87
-
88
-
89
-
90
-
91
-
92
-
93
-
94
-
95
-
96
-
97
-
98
-
99
-
100
-
101
-
102
-
103
-
104
-
105
-
106
-
107
-
108
-
109
-
110
-
111
-
112
-
113
-
114
-
115
-
116
-
117
-
118
-
119
-
120
-
121
-
122
-
123
-
124
-
125
-
126
-
127
-
128
-
129
-
130
-
131
-
132
-
133
-
134
-
135
-
136
-
137
-
138
-
139
-
140
-
141
-
142
-
143
-
144
-
145
-
146
-
147
-
148
-
149
-
150
-
151
-
152
-
153
-
154
-
155
-
156
-
157
-
158
-
159
-
160
-
161
-
162
-
163
-
164
-
165
-
166
-
167
-
168
-
169
-
170
-
171
-
172
-
173
-
174
-
175
-
176
-
177
-
178
-
179
-
180
-
181
-
182
-
183
-
184
-
185
-
 186
186 -
 187
187 -
 188
188 -
 189
189 -
 190
190 -
 191
191 -
 192
192 -
 193
193 -
 194
194 -
 195
195 -
 196
196 -
 197
197 -
 198
198 -
 199
199 -
 200
200 -
 201
201 -
 202
202 -
 203
203 -
 204
204 -
 205
205 -
 206
206 -
207
-
208
-
209
-
210
-
211
-
212
-
213
-
214
-
215
-
216
-
217
-
218
-
219
-
220
-
221
-
222
-
223
-
224
-
225
-
226
-
227
-
228
-
229
-
230
-
231
-
232
-
233
-
234
-
235
-
236
-
237
-
238
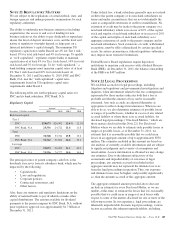
 |
 |

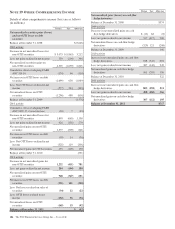
Pretax Tax After-tax
Pension and other postretirement benefit
plan adjustments
Balance at December 31, 2008 $(667)
2009 Activity $ 198 $(73) 125
Balance at December 31, 2009 (542)
2010 Activity 260 (98) 162
Balance at December 31, 2010 (380)
2011 Activity (593) 218 (375)
Balance at December 31, 2011 $(755)
Other (a)
Balance at December 31, 2008 $ (30)
2009 Activity
Foreign currency translation adj. $ 48 $(17) 31
BlackRock deferred tax adj. (13) (13)
SBA I/O strip valuation adj. 3 (1) 2
Total 2009 activity 51 (31) 20
Balance at December 31, 2009 (10)
2010 Activity
Foreign currency translation adj. (18) 6 (12)
BlackRock deferred tax adj. 1 1
SBA I/O strip valuation adj. (2) 1 (1)
Total 2010 activity (20) 8 (12)
Balance at December 31, 2010 (22)
2011 Activity
Foreign currency translation adj. (4) 1 (3)
Total 2011 activity (4) 1 (3)
Balance at December 31, 2011 $ (25)
(a) Consists of foreign currency translation adjustments, deferred tax adjustments on
BlackRock’s other comprehensive income, and for 2010 and 2009, interest-only
strip valuation adjustments.
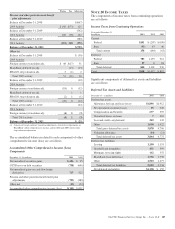
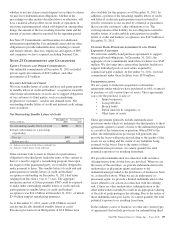
The accumulated balances related to each component of other
comprehensive income (loss) are as follows:
Accumulated Other Comprehensive Income (Loss)
Components
December 31 - In millions 2011 2010
Net unrealized securities gains $ 696 $95
OTTI losses on debt securities (738) (646)
Net unrealized gains on cash flow hedge
derivatives 717 522
Pension and other postretirement benefit plan
adjustments (755) (380)
Other, net (25) (22)
Accumulated other comprehensive income (loss) $(105) $(431)
N
OTE
20 I
NCOME
T
AXES
The components of income taxes from continuing operations
are as follows:
Income Taxes from Continuing Operations
Year ended December 31
In millions 2011 2010 2009
Current
Federal $191 $ (207) $(109)
State (33) 43 46
Total current 158 (164) (63)
Deferred
Federal 783 1,193 912
State 57 818
Total deferred 840 1,201 930
Total $998 $1,037 $ 867
Significant components of deferred tax assets and liabilities
are as follows:
Deferred Tax Assets and Liabilities
December 31 - in millions 2011 2010
Deferred tax assets
Allowance for loan and lease losses $1,896 $1,912
Net unrealized securities losses 25 320
Compensation and benefits 677 595
Unrealized losses on loans 7402
Loss and credit carryforward 243 145
Other 1,030 1,422
Total gross deferred tax assets 3,878 4,796
Valuation allowance (14) (21)
Total deferred tax assets 3,864 4,775
Deferred tax liabilities
Leasing 1,150 1,153
Goodwill and intangibles 431 399
Mortgage servicing rights 162 355
BlackRock basis difference 1,736 1,750
Other 1,523 1,277
Total deferred tax liabilities 5,002 4,934
Net deferred tax liability $1,138 $ 159
The PNC Financial Services Group, Inc. – Form 10-K 187