PNC Bank 2011 Annual Report Download - page 88
Download and view the complete annual report
Please find page 88 of the 2011 PNC Bank annual report below. You can navigate through the pages in the report by either clicking on the pages listed below, or by using the keyword search tool below to find specific information within the annual report.-
 1
1 -
2
-
3
-
4
-
5
-
6
-
7
-
8
-
9
-
10
-
11
-
12
-
13
-
14
-
15
-
16
-
17
-
18
-
19
-
20
-
21
-
22
-
23
-
24
-
25
-
26
-
27
-
28
-
29
-
30
-
31
-
32
-
33
-
34
-
35
-
36
-
37
-
38
-
39
-
40
-
41
-
42
-
43
-
44
-
45
-
46
-
47
-
48
-
49
-
50
-
51
-
52
-
53
-
54
-
55
-
56
-
57
-
58
-
59
-
60
-
61
-
62
-
63
-
64
-
65
-
66
-
67
-
68
-
69
-
70
-
71
-
72
-
73
-
74
-
75
-
76
-
77
-
 78
78 -
 79
79 -
 80
80 -
 81
81 -
 82
82 -
 83
83 -
 84
84 -
 85
85 -
 86
86 -
 87
87 -
 88
88 -
 89
89 -
 90
90 -
 91
91 -
 92
92 -
 93
93 -
 94
94 -
 95
95 -
 96
96 -
 97
97 -
 98
98 -
99
-
100
-
101
-
102
-
103
-
104
-
105
-
106
-
107
-
108
-
109
-
110
-
111
-
112
-
113
-
114
-
115
-
116
-
117
-
118
-
119
-
120
-
121
-
122
-
123
-
124
-
125
-
126
-
127
-
128
-
129
-
130
-
131
-
132
-
133
-
134
-
135
-
136
-
137
-
138
-
139
-
140
-
141
-
142
-
143
-
144
-
145
-
146
-
147
-
148
-
149
-
150
-
151
-
152
-
153
-
154
-
155
-
156
-
157
-
158
-
159
-
160
-
161
-
162
-
163
-
164
-
165
-
166
-
167
-
168
-
169
-
170
-
171
-
172
-
173
-
174
-
175
-
176
-
177
-
178
-
179
-
180
-
181
-
182
-
183
-
184
-
185
-
186
-
187
-
188
-
189
-
190
-
191
-
192
-
193
-
194
-
195
-
196
-
197
-
198
-
199
-
200
-
201
-
202
-
203
-
204
-
205
-
206
-
207
-
208
-
209
-
210
-
211
-
212
-
213
-
214
-
215
-
216
-
217
-
218
-
219
-
220
-
221
-
222
-
223
-
224
-
225
-
226
-
227
-
228
-
229
-
230
-
231
-
232
-
233
-
234
-
235
-
236
-
237
-
238
 |
 |

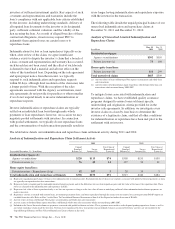
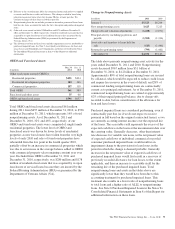
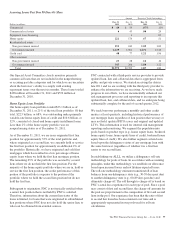
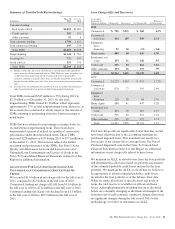
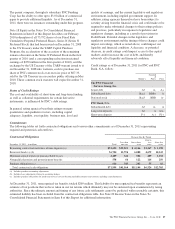
Bank-Owned Consumer Real Estate Related Loan Modifications
December 31, 2011 December 31, 2010
Dollars in millions
Number of
Accounts
Unpaid
Principal
Balance
Number of
Accounts
Unpaid
Principal
Balance
Home Equity
Temporary Modifications 13,352 $1,215 12,643 $1,151
Permanent Modifications 1,533 92 163 17
Total Home Equity 14,885 1,307 12,806 1,168
Residential Mortgages
Permanent Modifications 7,473 1,342 5,517 1,137
Non-Prime Mortgages
Permanent Modifications 4,355 610 3,405 441
Residential Construction
Permanent Modifications 1,282 578 470 235
Total Bank-Owned Consumer Real Estate Related Loan Modifications 27,995 $3,837 22,198 $2,981
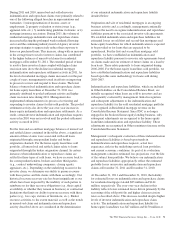
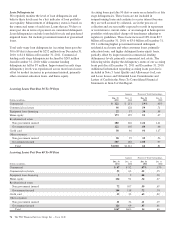
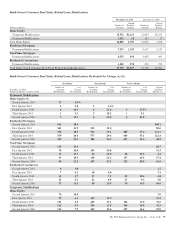
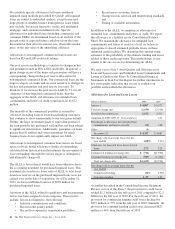
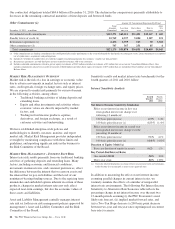
Bank-Owned Consumer Real Estate Related Loan Modifications Re-Default by Vintage (a) (b)
Six Months Nine Months Twelve Months
December 31, 2011
Dollars in millions, except as noted
Number of
Accounts
Re-defaulted
%of
Vintage
Re-defaulted
Number of
Accounts
Re-defaulted
%of
Vintage
Re-defaulted
Number of
Accounts
Re-defaulted
%of
Vintage
Re-defaulted
Unpaid
Principal
Balance (c)
Permanent Modifications
Home Equity (d)
Second Quarter 2011 17 4.9%
First Quarter 2011 1 2.8 2 5.6%
Fourth Quarter 2010 4 14.3 6 21.4 5 17.9%
Third Quarter 2010 1 9.1 2 18.2 1 9.1
Second Quarter 2010 2 12.5 4 25.0 4 25.0
Residential Mortgages
Second Quarter 2011 391 28.0 $68.1
First Quarter 2011 361 21.9 511 31.0 82.6
Fourth Quarter 2010 338 18.3 536 29.1 689 37.4 111.7
Third Quarter 2010 479 24.6 577 29.6 684 35.1 112.4
Second Quarter 2010 303 21.3 384 26.9 447 31.4 68.2
Non-Prime Mortgages
Second Quarter 2011 119 19.6 20.7
First Quarter 2011 78 18.4 105 24.8 13.3
Fourth Quarter 2010 13 13.5 24 25.0 28 29.2 4.4
Third Quarter 2010 93 18.3 110 21.6 137 26.9 17.4
Second Quarter 2010 99 23.2 107 25.1 123 28.9 16.6
Residential Construction
Second Quarter 2011 4 3.8 1.2
First Quarter 2011 7 4.2 10 6.0 3.1
Fourth Quarter 2010 11 4.7 17 7.2 25 10.6 6.8
Third Quarter 2010 24 8.2 26 8.9 27 9.2 4.0
Second Quarter 2010 37 13.6 38 13.9 39 14.3 10.6
Temporary Modifications
Home Equity
Second Quarter 2011 74 10.8 7.0
First Quarter 2011 99 6.6 169 11.3 15.2
Fourth Quarter 2010 131 6.5 265 13.1 344 17.0 31.6
Third Quarter 2010 142 6.9 246 12.0 368 18.0 32.5
Second Quarter 2010 165 7.9 260 12.4 347 16.6 29.0
The PNC Financial Services Group, Inc. – Form 10-K 79