PNC Bank 2011 Annual Report Download - page 167
Download and view the complete annual report
Please find page 167 of the 2011 PNC Bank annual report below. You can navigate through the pages in the report by either clicking on the pages listed below, or by using the keyword search tool below to find specific information within the annual report.-
 1
1 -
2
-
3
-
4
-
5
-
6
-
7
-
8
-
9
-
10
-
11
-
12
-
13
-
14
-
15
-
16
-
17
-
18
-
19
-
20
-
21
-
22
-
23
-
24
-
25
-
26
-
27
-
28
-
29
-
30
-
31
-
32
-
33
-
34
-
35
-
36
-
37
-
38
-
39
-
40
-
41
-
42
-
43
-
44
-
45
-
46
-
47
-
48
-
49
-
50
-
51
-
52
-
53
-
54
-
55
-
56
-
57
-
58
-
59
-
60
-
61
-
62
-
63
-
64
-
65
-
66
-
67
-
68
-
69
-
70
-
71
-
72
-
73
-
74
-
75
-
76
-
77
-
78
-
79
-
80
-
81
-
82
-
83
-
84
-
85
-
86
-
87
-
88
-
89
-
90
-
91
-
92
-
93
-
94
-
95
-
96
-
97
-
98
-
99
-
100
-
101
-
102
-
103
-
104
-
105
-
106
-
107
-
108
-
109
-
110
-
111
-
112
-
113
-
114
-
115
-
116
-
117
-
118
-
119
-
120
-
121
-
122
-
123
-
124
-
125
-
126
-
127
-
128
-
129
-
130
-
131
-
132
-
133
-
134
-
135
-
136
-
137
-
138
-
139
-
140
-
141
-
142
-
143
-
144
-
145
-
146
-
147
-
148
-
149
-
150
-
151
-
152
-
153
-
154
-
155
-
156
-
 157
157 -
 158
158 -
 159
159 -
 160
160 -
 161
161 -
 162
162 -
 163
163 -
 164
164 -
 165
165 -
 166
166 -
 167
167 -
 168
168 -
 169
169 -
 170
170 -
 171
171 -
 172
172 -
 173
173 -
 174
174 -
 175
175 -
 176
176 -
 177
177 -
178
-
179
-
180
-
181
-
182
-
183
-
184
-
185
-
186
-
187
-
188
-
189
-
190
-
191
-
192
-
193
-
194
-
195
-
196
-
197
-
198
-
199
-
200
-
201
-
202
-
203
-
204
-
205
-
206
-
207
-
208
-
209
-
210
-
211
-
212
-
213
-
214
-
215
-
216
-
217
-
218
-
219
-
220
-
221
-
222
-
223
-
224
-
225
-
226
-
227
-
228
-
229
-
230
-
231
-
232
-
233
-
234
-
235
-
236
-
237
-
238
 |
 |
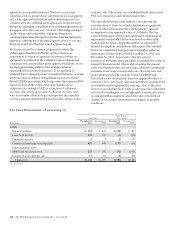
another third-party source, by reviewing valuations of
comparable instruments, or by comparison to internal
valuations.
N
ET
L
OANS
A
ND
L
OANS
H
ELD
F
OR
S
ALE
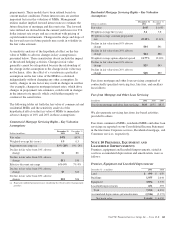
Fair values are estimated based on the discounted value of
expected net cash flows incorporating assumptions about
prepayment rates, net credit losses and servicing fees. For
purchased impaired loans, fair value is assumed to equal
PNC’s carrying value, which represents the present value of
expected future principal and interest cash flows, as adjusted
for any ALLL recorded for these loans. See Note 6 Purchased
Impaired Loans for additional information. For revolving
home equity loans and commercial credit lines, this fair value
does not include any amount for new loans or the related fees
that will be generated from the existing customer
relationships. Non-accrual loans are valued at their estimated
recovery value. Also refer to the Fair Value Measurement and
Fair Value Option sections of this Note 8 regarding the fair
value of commercial and residential mortgage loans held for
sale. Loans are presented net of the ALLL and do not include
future accretable discounts related to purchased impaired
loans.
O
THER
A
SSETS
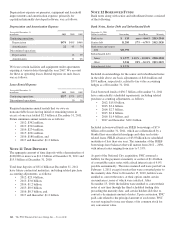
Other assets as shown in the preceding table include the
following:
• FHLB and FRB stock,
• equity investments carried at cost and fair value, and
• BlackRock Series C Preferred Stock.
Investments accounted for under the equity method, including
our investment in BlackRock, are not included in the
preceding table.
Refer to the Fair Value Measurement section of this Note 8
regarding the fair value of equity investments.
The aggregate carrying value of our investments that are
carried at cost and FHLB and FRB stock was $1.9 billion at
December 31, 2011 and $2.4 billion as of December 31, 2010,
both of which approximate fair value at each date.
M
ORTGAGE
S
ERVICING
A
SSETS
Fair value is based on the present value of the estimated future
cash flows, incorporating assumptions as to prepayment
speeds, discount rates, escrow balances, interest rates, cost to
service and other factors.
The key valuation assumptions for commercial and residential
mortgage loan servicing assets at December 31, 2011 and
December 31, 2010 are included in Note 9 Goodwill and
Other Intangible Assets.
C
USTOMER
R
ESALE
A
GREEMENTS
Refer to the Fair Value Measurement section of this Note 8
regarding the fair value of customer resale agreements.
D
EPOSITS
The carrying amounts of noninterest-bearing demand and
interest-bearing money market and savings deposits
approximate fair values. For time deposits, which include
foreign deposits, fair values are estimated based on the
discounted value of expected net cash flows assuming current
interest rates.
B
ORROWED
F
UNDS
The carrying amounts of Federal funds purchased, commercial
paper, repurchase agreements, trading securities sold short,
cash collateral, other short-term borrowings, acceptances
outstanding and accrued interest payable are considered to be
their fair value because of their short-term nature. For all other
borrowed funds, fair values are estimated primarily based on
dealer quotes or discounted cash flow analysis.
U
NFUNDED
L
OAN
C
OMMITMENTS
A
ND
L
ETTERS
O
F
C
REDIT
The fair value of unfunded loan commitments and letters of
credit is determined from a market participant’s view
including the impact of changes in interest rates, credit and
other factors. Because our obligation on substantially all
unfunded loan commitments and letters of credit varies with
changes in interest rates, these instruments are subject to little
fluctuation in fair value due to changes in interest rates. We
establish a liability on these facilities related to their
creditworthiness.
F
INANCIAL
D
ERIVATIVES
Refer to the Fair Value Measurement section of this Note 8
regarding the fair value of financial derivatives.
158 The PNC Financial Services Group, Inc. – Form 10-K