PNC Bank 2011 Annual Report Download - page 86
Download and view the complete annual report
Please find page 86 of the 2011 PNC Bank annual report below. You can navigate through the pages in the report by either clicking on the pages listed below, or by using the keyword search tool below to find specific information within the annual report.-
 1
1 -
2
-
3
-
4
-
5
-
6
-
7
-
8
-
9
-
10
-
11
-
12
-
13
-
14
-
15
-
16
-
17
-
18
-
19
-
20
-
21
-
22
-
23
-
24
-
25
-
26
-
27
-
28
-
29
-
30
-
31
-
32
-
33
-
34
-
35
-
36
-
37
-
38
-
39
-
40
-
41
-
42
-
43
-
44
-
45
-
46
-
47
-
48
-
49
-
50
-
51
-
52
-
53
-
54
-
55
-
56
-
57
-
58
-
59
-
60
-
61
-
62
-
63
-
64
-
65
-
66
-
67
-
68
-
69
-
70
-
71
-
72
-
73
-
74
-
75
-
 76
76 -
 77
77 -
 78
78 -
 79
79 -
 80
80 -
 81
81 -
 82
82 -
 83
83 -
 84
84 -
 85
85 -
 86
86 -
 87
87 -
 88
88 -
 89
89 -
 90
90 -
 91
91 -
 92
92 -
 93
93 -
 94
94 -
 95
95 -
 96
96 -
97
-
98
-
99
-
100
-
101
-
102
-
103
-
104
-
105
-
106
-
107
-
108
-
109
-
110
-
111
-
112
-
113
-
114
-
115
-
116
-
117
-
118
-
119
-
120
-
121
-
122
-
123
-
124
-
125
-
126
-
127
-
128
-
129
-
130
-
131
-
132
-
133
-
134
-
135
-
136
-
137
-
138
-
139
-
140
-
141
-
142
-
143
-
144
-
145
-
146
-
147
-
148
-
149
-
150
-
151
-
152
-
153
-
154
-
155
-
156
-
157
-
158
-
159
-
160
-
161
-
162
-
163
-
164
-
165
-
166
-
167
-
168
-
169
-
170
-
171
-
172
-
173
-
174
-
175
-
176
-
177
-
178
-
179
-
180
-
181
-
182
-
183
-
184
-
185
-
186
-
187
-
188
-
189
-
190
-
191
-
192
-
193
-
194
-
195
-
196
-
197
-
198
-
199
-
200
-
201
-
202
-
203
-
204
-
205
-
206
-
207
-
208
-
209
-
210
-
211
-
212
-
213
-
214
-
215
-
216
-
217
-
218
-
219
-
220
-
221
-
222
-
223
-
224
-
225
-
226
-
227
-
228
-
229
-
230
-
231
-
232
-
233
-
234
-
235
-
236
-
237
-
238
 |
 |
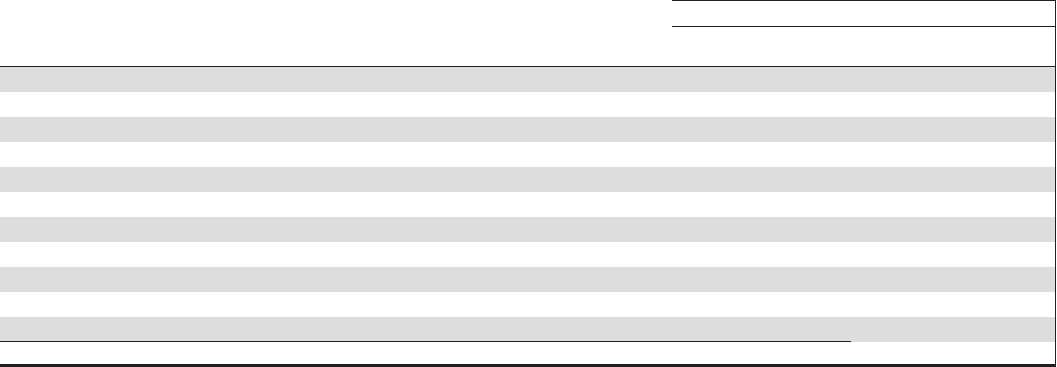
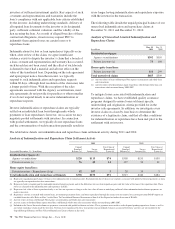
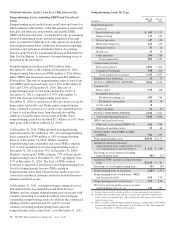
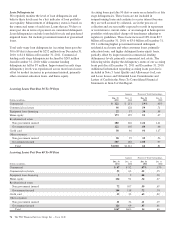
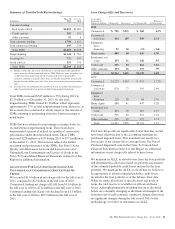
Accruing Loans Past Due 90 Days Or More
Amount Percent of Total Outstandings
Dollars in millions
Dec. 31
2011
Dec. 31
2010
Dec. 31
2011
Dec. 31
2010
Commercial $49 $59 .07% .11%
Commercial real estate 643 .04 .24
Equipment lease financing 1 .02
Home equity 221 174 .67 .51
Residential real estate
Non government insured 152 160 1.05 1.00
Government insured 2,129 1,961 14.71 12.26
Credit card 48 77 1.21 1.96
Other consumer
Non government insured 23 28 .12 .16
Government insured 345 206 1.80 1.22
Total $2,973 $2,709 1.87 1.80
Our Special Asset Committee closely monitors primarily
commercial loans that are not included in the nonperforming
or accruing past due categories and for which we are uncertain
about the borrower’s ability to comply with existing
repayment terms over the next six months. These loans totaled
$438 million at December 31, 2011 and $574 million at
December 31, 2010.
Home Equity Loan Portfolio
Our home equity loan portfolio totaled $33.1 billion as of
December 31, 2011, or 21% of the total loan portfolio. Of that
total, $22.5 billion, or 68%, was outstanding under primarily
variable-rate home equity lines of credit and $10.6 billion, or
32%, consisted of closed-end home equity installment loans.
Less than 2% of the home equity portfolio was on
nonperforming status as of December 31, 2011.
As of December 31, 2011, we are in an originated first lien
position for approximately 33% of the total portfolio and,
where originated as a second lien, we currently hold or service
the first lien position for approximately an additional 2% of
the portfolio. Historically, we have originated and sold first
mortgages which has resulted in a low percentage of home
equity loans where we hold the first lien mortgage position.
The remaining 65% of the portfolio was secured by second
liens where we do not hold the first lien position. For the
majority of the home equity portfolio where we are in, hold or
service the first lien position, the credit performance of this
portion of the portfolio is superior to the portion of the
portfolio where we hold the second lien position but do not
hold the first lien.
Subsequent to origination, PNC is not typically notified when
a senior lien position that is not held by PNC is satisfied.
Therefore, information about the current lien status of the
loans is limited, for loans that were originated in subordinated
lien positions where PNC does not also hold the senior lien, to
what can be obtained from external sources.
PNC contracted with a third-party service provider to provide
updated loan, lien and collateral data that is aggregated from
public and private sources. We started receiving the data in
late 2011 and we are working with the third-party provider to
enhance the information we are receiving. As we have made
progress in our efforts, we have incrementally enhanced our
risk management processes and reporting to incorporate this
updated loan, lien, and collateral data, and we anticipate being
substantially complete by the end of second quarter 2012.
We track borrower performance monthly and other credit
metrics at least quarterly, including historical performance of
any mortgage loans regardless of lien position that we may or
may not hold, updated FICO scores and original and updated
LTVs. This information is used for internal risk management
reporting and monitoring. We segment the population into
pools based on product type (e.g., home equity loans, brokered
home equity loans, home equity lines of credit, brokered home
equity lines of credit). We also further segment certain loans
based upon the delinquency status of any mortgage loan with
the same borrower (regardless of whether it is a first lien
senior to our second lien).
In establishing our ALLL, we utilize a delinquency roll-rate
methodology for pools of loans. In accordance with accounting
principles, under this methodology, we establish our allowance
based upon incurred losses and not lifetime expected losses.
The roll-rate methodology estimates transition/roll of loan
balances from one delinquency state (e.g., 30-59 days past due)
to another delinquency state (e.g., 60-89 days past due) and
ultimately charge-off. The roll through to charge-off is based on
PNC’s actual loss experience for each type of pool. Since a pool
may consist of first and second liens, the charge-off amounts for
the pool are proportionate to the composition of first and second
liens in the pool. Our experience has been that the ratio of first
to second lien loans has been consistent over time and is
appropriately represented in our pools used for roll-rate
calculations.
The PNC Financial Services Group, Inc. – Form 10-K 77