PNC Bank 2011 Annual Report Download - page 151
Download and view the complete annual report
Please find page 151 of the 2011 PNC Bank annual report below. You can navigate through the pages in the report by either clicking on the pages listed below, or by using the keyword search tool below to find specific information within the annual report.-
 1
1 -
2
-
3
-
4
-
5
-
6
-
7
-
8
-
9
-
10
-
11
-
12
-
13
-
14
-
15
-
16
-
17
-
18
-
19
-
20
-
21
-
22
-
23
-
24
-
25
-
26
-
27
-
28
-
29
-
30
-
31
-
32
-
33
-
34
-
35
-
36
-
37
-
38
-
39
-
40
-
41
-
42
-
43
-
44
-
45
-
46
-
47
-
48
-
49
-
50
-
51
-
52
-
53
-
54
-
55
-
56
-
57
-
58
-
59
-
60
-
61
-
62
-
63
-
64
-
65
-
66
-
67
-
68
-
69
-
70
-
71
-
72
-
73
-
74
-
75
-
76
-
77
-
78
-
79
-
80
-
81
-
82
-
83
-
84
-
85
-
86
-
87
-
88
-
89
-
90
-
91
-
92
-
93
-
94
-
95
-
96
-
97
-
98
-
99
-
100
-
101
-
102
-
103
-
104
-
105
-
106
-
107
-
108
-
109
-
110
-
111
-
112
-
113
-
114
-
115
-
116
-
117
-
118
-
119
-
120
-
121
-
122
-
123
-
124
-
125
-
126
-
127
-
128
-
129
-
130
-
131
-
132
-
133
-
134
-
135
-
136
-
137
-
138
-
139
-
140
-
 141
141 -
 142
142 -
 143
143 -
 144
144 -
 145
145 -
 146
146 -
 147
147 -
 148
148 -
 149
149 -
 150
150 -
 151
151 -
 152
152 -
 153
153 -
 154
154 -
 155
155 -
 156
156 -
 157
157 -
 158
158 -
 159
159 -
 160
160 -
 161
161 -
162
-
163
-
164
-
165
-
166
-
167
-
168
-
169
-
170
-
171
-
172
-
173
-
174
-
175
-
176
-
177
-
178
-
179
-
180
-
181
-
182
-
183
-
184
-
185
-
186
-
187
-
188
-
189
-
190
-
191
-
192
-
193
-
194
-
195
-
196
-
197
-
198
-
199
-
200
-
201
-
202
-
203
-
204
-
205
-
206
-
207
-
208
-
209
-
210
-
211
-
212
-
213
-
214
-
215
-
216
-
217
-
218
-
219
-
220
-
221
-
222
-
223
-
224
-
225
-
226
-
227
-
228
-
229
-
230
-
231
-
232
-
233
-
234
-
235
-
236
-
237
-
238
 |
 |

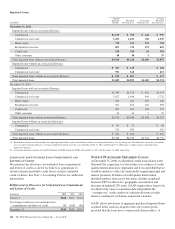
N
OTE
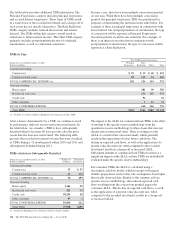
7I
NVESTMENT
S
ECURITIES
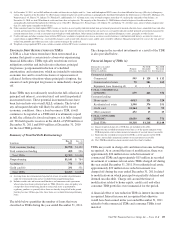
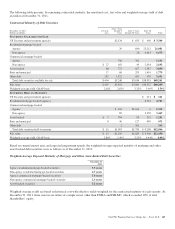
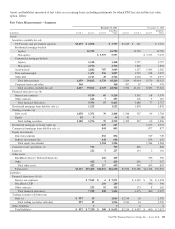
Investment Securities Summary
In millions
Amortized
Cost
Unrealized Fair
ValueGains Losses
December 31, 2011
S
ECURITIES
A
VAILABLE FOR
S
ALE
Debt securities
US Treasury and government agencies $ 3,369 $ 348 $ 3,717
Residential mortgage-backed
Agency 26,081 772 $ (61) 26,792
Non-agency 6,673 152 (1,268) 5,557
Commercial mortgage-backed
Agency 1,101 39 1,140
Non-agency 2,693 80 (17) 2,756
Asset-backed 3,854 31 (216) 3,669
State and municipal 1,779 75 (47) 1,807
Other debt 2,691 83 (12) 2,762
Total debt securities 48,241 1,580 (1,621) 48,200
Corporate stocks and other 368 368
Total securities available for sale $48,609 $1,580 $(1,621) $48,568
S
ECURITIES
H
ELD TO
M
ATURITY
Debt securities
US Treasury and government agencies $ 221 $ 40 $ 261
Residential mortgage-backed (agency) 4,761 131 $ (1) 4,891
Commercial mortgage-backed
Agency 1,332 50 1,382
Non-agency 3,467 108 (2) 3,573
Asset-backed 1,251 14 (3) 1,262
State and municipal 671 31 702
Other debt 363 16 379
Total securities held to maturity $12,066 $ 390 $ (6) $12,450
December 31, 2010
S
ECURITIES
A
VAILABLE FOR
S
ALE
Debt securities
US Treasury and government agencies $ 5,575 $ 157 $ (22) $ 5,710
Residential mortgage-backed
Agency 31,697 443 (420) 31,720
Non-agency 8,193 230 (1,190) 7,233
Commercial mortgage-backed
Agency 1,763 40 (6) 1,797
Non-agency 1,794 73 (11) 1,856
Asset-backed 2,780 40 (238) 2,582
State and municipal 1,999 30 (72) 1,957
Other debt 3,992 102 (17) 4,077
Total debt securities 57,793 1,115 (1,976) 56,932
Corporate stocks and other 378 378
Total securities available for sale $58,171 $1,115 $(1,976) $57,310
S
ECURITIES
H
ELD TO
M
ATURITY
Debt securities
Commercial mortgage-backed (non-agency) $ 4,316 $ 178 $ (4) $ 4,490
Asset-backed 2,626 51 (1) 2,676
Other debt 10 1 11
Total securities held to maturity $ 6,952 $ 230 $ (5) $ 7,177
142 The PNC Financial Services Group, Inc. – Form 10-K