PNC Bank 2011 Annual Report Download - page 111
Download and view the complete annual report
Please find page 111 of the 2011 PNC Bank annual report below. You can navigate through the pages in the report by either clicking on the pages listed below, or by using the keyword search tool below to find specific information within the annual report.-
 1
1 -
2
-
3
-
4
-
5
-
6
-
7
-
8
-
9
-
10
-
11
-
12
-
13
-
14
-
15
-
16
-
17
-
18
-
19
-
20
-
21
-
22
-
23
-
24
-
25
-
26
-
27
-
28
-
29
-
30
-
31
-
32
-
33
-
34
-
35
-
36
-
37
-
38
-
39
-
40
-
41
-
42
-
43
-
44
-
45
-
46
-
47
-
48
-
49
-
50
-
51
-
52
-
53
-
54
-
55
-
56
-
57
-
58
-
59
-
60
-
61
-
62
-
63
-
64
-
65
-
66
-
67
-
68
-
69
-
70
-
71
-
72
-
73
-
74
-
75
-
76
-
77
-
78
-
79
-
80
-
81
-
82
-
83
-
84
-
85
-
86
-
87
-
88
-
89
-
90
-
91
-
92
-
93
-
94
-
95
-
96
-
97
-
98
-
99
-
100
-
 101
101 -
 102
102 -
 103
103 -
 104
104 -
 105
105 -
 106
106 -
 107
107 -
 108
108 -
 109
109 -
 110
110 -
 111
111 -
 112
112 -
 113
113 -
 114
114 -
 115
115 -
 116
116 -
 117
117 -
 118
118 -
 119
119 -
 120
120 -
 121
121 -
122
-
123
-
124
-
125
-
126
-
127
-
128
-
129
-
130
-
131
-
132
-
133
-
134
-
135
-
136
-
137
-
138
-
139
-
140
-
141
-
142
-
143
-
144
-
145
-
146
-
147
-
148
-
149
-
150
-
151
-
152
-
153
-
154
-
155
-
156
-
157
-
158
-
159
-
160
-
161
-
162
-
163
-
164
-
165
-
166
-
167
-
168
-
169
-
170
-
171
-
172
-
173
-
174
-
175
-
176
-
177
-
178
-
179
-
180
-
181
-
182
-
183
-
184
-
185
-
186
-
187
-
188
-
189
-
190
-
191
-
192
-
193
-
194
-
195
-
196
-
197
-
198
-
199
-
200
-
201
-
202
-
203
-
204
-
205
-
206
-
207
-
208
-
209
-
210
-
211
-
212
-
213
-
214
-
215
-
216
-
217
-
218
-
219
-
220
-
221
-
222
-
223
-
224
-
225
-
226
-
227
-
228
-
229
-
230
-
231
-
232
-
233
-
234
-
235
-
236
-
237
-
238
 |
 |

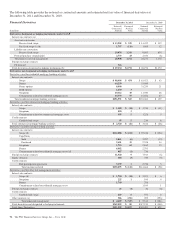
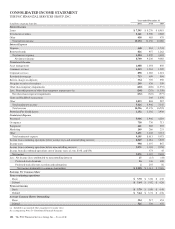
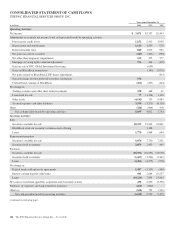
CONSOLIDATED INCOME STATEMENT
THE PNC FINANCIAL SERVICES GROUP, INC.
Year ended December 31
In millions, except per share data 2011 2010 2009
Interest Income
Loans $ 7,595 $ 8,276 $ 8,919
Investment securities 2,161 2,389 2,688
Other 438 485 479
Total interest income 10,194 11,150 12,086
Interest Expense
Deposits 668 963 1,741
Borrowed funds 826 957 1,262
Total interest expense 1,494 1,920 3,003
Net interest income 8,700 9,230 9,083
Noninterest Income
Asset management 1,088 1,054 858
Consumer services 1,243 1,261 1,290
Corporate services 898 1,082 1,021
Residential mortgage 713 699 990
Service charges on deposits 534 705 950
Net gains on sales of securities 249 426 550
Other-than-temporary impairments (420) (608) (1,935)
Less: Noncredit portion of other-than-temporary impairments (a) (268) (283) (1,358)
Net other-than-temporary impairments (152) (325) (577)
Gains on BlackRock transactions 160 1,076
Other 1,053 884 987
Total noninterest income 5,626 5,946 7,145
Total revenue 14,326 15,176 16,228
Provision For Credit Losses 1,152 2,502 3,930
Noninterest Expense
Personnel 3,966 3,906 4,119
Occupancy 738 730 713
Equipment 661 668 695
Marketing 249 266 233
Other 3,491 3,043 3,313
Total noninterest expense 9,105 8,613 9,073
Income from continuing operations before income taxes and noncontrolling interests 4,069 4,061 3,225
Income taxes 998 1,037 867
Income from continuing operations before noncontrolling interests 3,071 3,024 2,358
Income from discontinued operations (net of income taxes of zero, $338, and $54) 373 45
Net income 3,071 3,397 2,403
Less: Net income (loss) attributable to noncontrolling interests 15 (15) (44)
Preferred stock dividends 56 146 388
Preferred stock discount accretion and redemptions 2255 56
Net income attributable to common shareholders $ 2,998 $ 3,011 $ 2,003
Earnings Per Common Share
From continuing operations
Basic $ 5.70 $ 5.08 $ 4.30
Diluted $ 5.64 $ 5.02 $ 4.26
From net income
Basic $ 5.70 $ 5.80 $ 4.40
Diluted $ 5.64 $ 5.74 $ 4.36
Average Common Shares Outstanding
Basic 524 517 454
Diluted 526 520 455
(a) Included in accumulated other comprehensive income (loss).
See accompanying Notes To Consolidated Financial Statements.
102 The PNC Financial Services Group, Inc. – Form 10-K