PNC Bank 2011 Annual Report Download - page 101
Download and view the complete annual report
Please find page 101 of the 2011 PNC Bank annual report below. You can navigate through the pages in the report by either clicking on the pages listed below, or by using the keyword search tool below to find specific information within the annual report.-
 1
1 -
2
-
3
-
4
-
5
-
6
-
7
-
8
-
9
-
10
-
11
-
12
-
13
-
14
-
15
-
16
-
17
-
18
-
19
-
20
-
21
-
22
-
23
-
24
-
25
-
26
-
27
-
28
-
29
-
30
-
31
-
32
-
33
-
34
-
35
-
36
-
37
-
38
-
39
-
40
-
41
-
42
-
43
-
44
-
45
-
46
-
47
-
48
-
49
-
50
-
51
-
52
-
53
-
54
-
55
-
56
-
57
-
58
-
59
-
60
-
61
-
62
-
63
-
64
-
65
-
66
-
67
-
68
-
69
-
70
-
71
-
72
-
73
-
74
-
75
-
76
-
77
-
78
-
79
-
80
-
81
-
82
-
83
-
84
-
85
-
86
-
87
-
88
-
89
-
90
-
 91
91 -
 92
92 -
 93
93 -
 94
94 -
 95
95 -
 96
96 -
 97
97 -
 98
98 -
 99
99 -
 100
100 -
 101
101 -
 102
102 -
 103
103 -
 104
104 -
 105
105 -
 106
106 -
 107
107 -
 108
108 -
 109
109 -
 110
110 -
 111
111 -
112
-
113
-
114
-
115
-
116
-
117
-
118
-
119
-
120
-
121
-
122
-
123
-
124
-
125
-
126
-
127
-
128
-
129
-
130
-
131
-
132
-
133
-
134
-
135
-
136
-
137
-
138
-
139
-
140
-
141
-
142
-
143
-
144
-
145
-
146
-
147
-
148
-
149
-
150
-
151
-
152
-
153
-
154
-
155
-
156
-
157
-
158
-
159
-
160
-
161
-
162
-
163
-
164
-
165
-
166
-
167
-
168
-
169
-
170
-
171
-
172
-
173
-
174
-
175
-
176
-
177
-
178
-
179
-
180
-
181
-
182
-
183
-
184
-
185
-
186
-
187
-
188
-
189
-
190
-
191
-
192
-
193
-
194
-
195
-
196
-
197
-
198
-
199
-
200
-
201
-
202
-
203
-
204
-
205
-
206
-
207
-
208
-
209
-
210
-
211
-
212
-
213
-
214
-
215
-
216
-
217
-
218
-
219
-
220
-
221
-
222
-
223
-
224
-
225
-
226
-
227
-
228
-
229
-
230
-
231
-
232
-
233
-
234
-
235
-
236
-
237
-
238
 |
 |

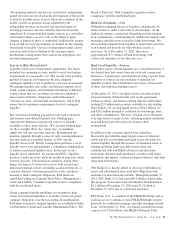
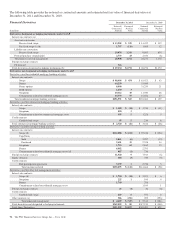
The following table provides the notional or contractual amounts and estimated net fair value of financial derivatives at
December 31, 2011 and December 31, 2010.
Financial Derivatives December 31, 2011 December 31, 2010
In millions
Notional/
Contractual
Amount
Estimated
Net Fair
Value
Notional/
Contractual
Amount
Estimated
Net Fair
Value
Derivatives designated as hedging instruments under GAAP
Interest rate contracts (a)
Asset rate conversion
Receive fixed swaps $ 13,902 $ 529 $ 14,452 $ 332
Pay fixed swaps (c) (d) 1,797 (116) 1,669 12
Liability rate conversion
Receive fixed swaps 10,476 1,316 9,803 834
Forward purchase commitments 2,733 43 2,350 (8)
Total interest rate risk management 28,908 1,772 28,274 1,170
Foreign exchange contracts
FX forward 326
Total derivatives designated as hedging instruments (b) $ 29,234 $1,772 $ 28,274 $1,170
Derivatives not designated as hedging instruments under GAAP
Derivatives used for residential mortgage banking activities:
Interest rate contracts
Swaps $ 98,406 $ 454 $ 83,421 $ 63
Futures 64,250 51,699
Future options 8,000 31,250 21
Bond options 1,250 3
Swaptions 10,312 49 11,040 28
Commitments related to residential mortgage assets 14,773 59 16,652 47
Total residential mortgage banking activities $196,991 $ 565 $194,062 $ 159
Derivatives used for commercial mortgage banking activities:
Interest rate contracts
Swaps $ 1,180 $ (34) $ 1,744 $ (41)
Swaptions 450 3
Commitments related to commercial mortgage assets 995 5 1,228 5
Credit contracts
Credit default swaps 95 5 210 8
Total commercial mortgage banking activities $ 2,720 $ (21) $ 3,182 $ (28)
Derivatives used for customer-related activities:
Interest rate contracts
Swaps (d) $122,088 $ (214) $ 92,248 $ (104)
Caps/floors
Sold 5,861 (6) 3,207 (15)
Purchased 5,601 19 2,528 14
Swaptions 1,713 63 2,165 13
Futures 6,982 2,793
Commitments related to residential mortgage assets (d) 487 (1) 738
Foreign exchange contracts 11,920 9 7,913 (6)
Equity contracts 184 (3) 334 (3)
Credit contracts
Risk participation agreements 3,259 1 2,738 3
Total customer-related $158,095 $ (132) $114,664 $ (98)
Derivatives used for other risk management activities:
Interest rate contracts
Swaps (d) $ 1,704 $ (34) $ 3,021 $ 6
Swaptions 225 1 100 4
Futures 1,740 298
Commitments related to residential mortgage assets 1,100 1
Foreign exchange contracts 25 (4) 32 (4)
Credit contracts
Credit default swaps 209 6 551 8
Other contracts (e) 386 (296) 209 (396)
Total other risk management $ 4,289 $ (327) $ 5,311 $ (381)
Total derivatives not designated as hedging instruments $362,095 $ 85 $317,219 $ (348)
Total Gross Derivatives $391,329 $1,857 $345,493 $ 822
92 The PNC Financial Services Group, Inc. – Form 10-K