PNC Bank 2011 Annual Report Download - page 70
Download and view the complete annual report
Please find page 70 of the 2011 PNC Bank annual report below. You can navigate through the pages in the report by either clicking on the pages listed below, or by using the keyword search tool below to find specific information within the annual report.-
 1
1 -
2
-
3
-
4
-
5
-
6
-
7
-
8
-
9
-
10
-
11
-
12
-
13
-
14
-
15
-
16
-
17
-
18
-
19
-
20
-
21
-
22
-
23
-
24
-
25
-
26
-
27
-
28
-
29
-
30
-
31
-
32
-
33
-
34
-
35
-
36
-
37
-
38
-
39
-
40
-
41
-
42
-
43
-
44
-
45
-
46
-
47
-
48
-
49
-
50
-
51
-
52
-
53
-
54
-
55
-
56
-
57
-
58
-
59
-
 60
60 -
 61
61 -
 62
62 -
 63
63 -
 64
64 -
 65
65 -
 66
66 -
 67
67 -
 68
68 -
 69
69 -
 70
70 -
 71
71 -
 72
72 -
 73
73 -
 74
74 -
 75
75 -
 76
76 -
 77
77 -
 78
78 -
 79
79 -
 80
80 -
81
-
82
-
83
-
84
-
85
-
86
-
87
-
88
-
89
-
90
-
91
-
92
-
93
-
94
-
95
-
96
-
97
-
98
-
99
-
100
-
101
-
102
-
103
-
104
-
105
-
106
-
107
-
108
-
109
-
110
-
111
-
112
-
113
-
114
-
115
-
116
-
117
-
118
-
119
-
120
-
121
-
122
-
123
-
124
-
125
-
126
-
127
-
128
-
129
-
130
-
131
-
132
-
133
-
134
-
135
-
136
-
137
-
138
-
139
-
140
-
141
-
142
-
143
-
144
-
145
-
146
-
147
-
148
-
149
-
150
-
151
-
152
-
153
-
154
-
155
-
156
-
157
-
158
-
159
-
160
-
161
-
162
-
163
-
164
-
165
-
166
-
167
-
168
-
169
-
170
-
171
-
172
-
173
-
174
-
175
-
176
-
177
-
178
-
179
-
180
-
181
-
182
-
183
-
184
-
185
-
186
-
187
-
188
-
189
-
190
-
191
-
192
-
193
-
194
-
195
-
196
-
197
-
198
-
199
-
200
-
201
-
202
-
203
-
204
-
205
-
206
-
207
-
208
-
209
-
210
-
211
-
212
-
213
-
214
-
215
-
216
-
217
-
218
-
219
-
220
-
221
-
222
-
223
-
224
-
225
-
226
-
227
-
228
-
229
-
230
-
231
-
232
-
233
-
234
-
235
-
236
-
237
-
238
 |
 |

N
ON
-S
TRATEGIC
A
SSETS
P
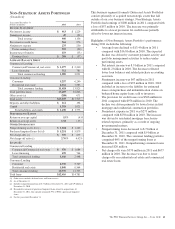
ORTFOLIO
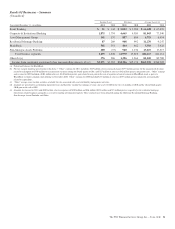
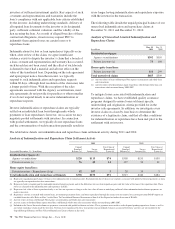
(Unaudited)
Year ended December 31
Dollars in millions 2011 2010
I
NCOME
S
TATEMENT
Net interest income $ 913 $ 1,229
Noninterest income 47 (93)
Total revenue 960 1,136
Provision for credit losses 366 976
Noninterest expense 275 250
Pretax earnings (loss) 319 (90)
Income taxes (benefit) 119 (33)
Earnings (loss) $ 200 $ (57)
A
VERAGE
B
ALANCE
S
HEET
Commercial Lending:
Commercial/Commercial real estate $ 1,277 $ 2,240
Lease financing 712 781
Total commercial lending 1,989 3,021
Consumer Lending:
Consumer 5,257 6,240
Residential real estate 6,161 7,585
Total consumer lending 11,418 13,825
Total portfolio loans 13,407 16,846
Other assets (a) (288) 671
Total assets $13,119 $17,517
Deposits and other liabilities $ 111 154
Capital 1,319 1,621
Total liabilities and equity $ 1,430 $ 1,775
P
ERFORMANCE
R
ATIOS
Return on average capital 15% (4)%
Return on average assets 1.52 (.33)
O
THER
I
NFORMATION
Nonperforming assets (b) (c) $ 1,024 $ 1,242
Purchased impaired loans (b) (d) $ 5,251 $ 5,879
Net charge-offs (e) $ 370 $ 677
Net charge-off ratio (e) 2.76% 4.02%
L
OANS
(b)
Commercial Lending
Commercial/Commercial real estate $ 976 $ 1,684
Lease financing 670 764
Total commercial lending 1,646 2,448
Consumer Lending
Consumer 4,930 5,769
Residential real estate 5,840 6,564
Total consumer lending 10,770 12,333
Total loans $12,416 $14,781
(a) Other assets includes deferred taxes and loan reserves.
(b) As of December 31.
(c) Includes nonperforming loans of $.7 billion at December 31, 2011 and $.9 billion at
December 31, 2010.
(d) Recorded investment of purchased impaired loans related to acquisitions. At
December 31, 2011, this segment contained 79% of PNC’s purchased impaired
loans.
(e) For the year ended December 31.
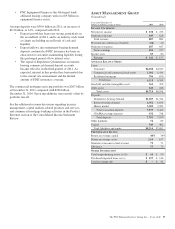
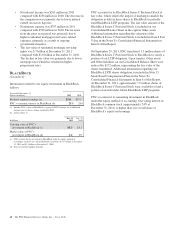
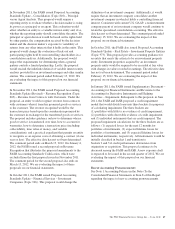
This business segment (formerly Distressed Assets Portfolio)
consists primarily of acquired non-strategic assets that fall
outside of our core business strategy. Non-Strategic Assets
Portfolio had earnings of $200 million in 2011 compared with
a loss of $57 million in 2010. The increase was primarily
attributable to a lower provision for credit losses partially
offset by lower net interest income.
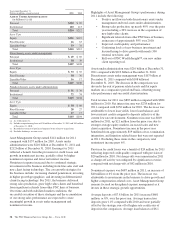
Highlights of Non-Strategic Assets Portfolio’s performance
during 2011 include the following:
• Average loans declined to $13.4 billion in 2011
compared with $16.8 billion in 2010. The expected
decline was driven by customer payment activity and
portfolio management activities to reduce under-
performing assets.
• Net interest income was $.9 billion in 2011 compared
with $1.2 billion in 2010. The decrease reflected
lower loan balances and related purchase accounting
accretion.
• Noninterest income was $47 million in 2011
compared with a loss of $93 million in 2010. 2010
included an increase to the liability for estimated
losses on repurchase and indemnification claims on
brokered home equity loans sold to investors.
• The provision for credit losses was $366 million in
2011 compared with $976 million in 2010. The
decline was driven primarily by lower losses in first
mortgage and residential construction portfolios.
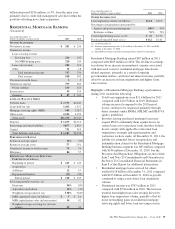
• Noninterest expense in 2011 was $275 million
compared with $250 million in 2010. The increase
was driven by residential mortgage foreclosure-
related expenses, primarily as a result of ongoing
governmental matters.
• Nonperforming loans decreased to $.7 billion at
December 31, 2011 compared with $.9 billion at
December 31, 2010. The consumer lending portfolio
comprised 66% of the nonperforming loans at
December 31, 2011. Nonperforming consumer loans
increased $20 million.
• Net charge-offs were $370 million in 2011 and $677
million in 2010. The decrease was due to lower
charge-offs on residential real estate and commercial
real estate loans.
The PNC Financial Services Group, Inc. – Form 10-K 61