PNC Bank 2011 Annual Report Download - page 54
Download and view the complete annual report
Please find page 54 of the 2011 PNC Bank annual report below. You can navigate through the pages in the report by either clicking on the pages listed below, or by using the keyword search tool below to find specific information within the annual report.-
 1
1 -
2
-
3
-
4
-
5
-
6
-
7
-
8
-
9
-
10
-
11
-
12
-
13
-
14
-
15
-
16
-
17
-
18
-
19
-
20
-
21
-
22
-
23
-
24
-
25
-
26
-
27
-
28
-
29
-
30
-
31
-
32
-
33
-
34
-
35
-
36
-
37
-
38
-
39
-
40
-
41
-
42
-
43
-
 44
44 -
 45
45 -
 46
46 -
 47
47 -
 48
48 -
 49
49 -
 50
50 -
 51
51 -
 52
52 -
 53
53 -
 54
54 -
 55
55 -
 56
56 -
 57
57 -
 58
58 -
 59
59 -
 60
60 -
 61
61 -
 62
62 -
 63
63 -
 64
64 -
65
-
66
-
67
-
68
-
69
-
70
-
71
-
72
-
73
-
74
-
75
-
76
-
77
-
78
-
79
-
80
-
81
-
82
-
83
-
84
-
85
-
86
-
87
-
88
-
89
-
90
-
91
-
92
-
93
-
94
-
95
-
96
-
97
-
98
-
99
-
100
-
101
-
102
-
103
-
104
-
105
-
106
-
107
-
108
-
109
-
110
-
111
-
112
-
113
-
114
-
115
-
116
-
117
-
118
-
119
-
120
-
121
-
122
-
123
-
124
-
125
-
126
-
127
-
128
-
129
-
130
-
131
-
132
-
133
-
134
-
135
-
136
-
137
-
138
-
139
-
140
-
141
-
142
-
143
-
144
-
145
-
146
-
147
-
148
-
149
-
150
-
151
-
152
-
153
-
154
-
155
-
156
-
157
-
158
-
159
-
160
-
161
-
162
-
163
-
164
-
165
-
166
-
167
-
168
-
169
-
170
-
171
-
172
-
173
-
174
-
175
-
176
-
177
-
178
-
179
-
180
-
181
-
182
-
183
-
184
-
185
-
186
-
187
-
188
-
189
-
190
-
191
-
192
-
193
-
194
-
195
-
196
-
197
-
198
-
199
-
200
-
201
-
202
-
203
-
204
-
205
-
206
-
207
-
208
-
209
-
210
-
211
-
212
-
213
-
214
-
215
-
216
-
217
-
218
-
219
-
220
-
221
-
222
-
223
-
224
-
225
-
226
-
227
-
228
-
229
-
230
-
231
-
232
-
233
-
234
-
235
-
236
-
237
-
238
 |
 |

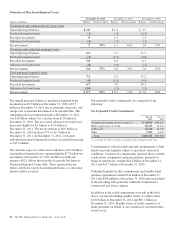
L
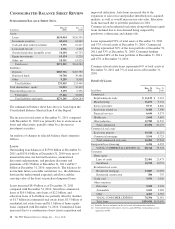
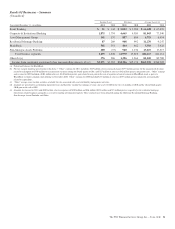
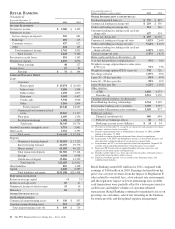
OANS
H
ELD
F
OR
S
ALE
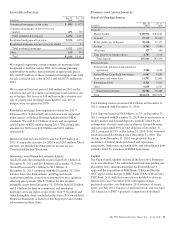
In millions
Dec. 31
2011
Dec. 31
2010
Commercial mortgages at fair value $ 843 $ 877
Commercial mortgages at lower of cost or
market 451 330
Total commercial mortgages 1,294 1,207
Residential mortgages at fair value 1,522 1,878
Residential mortgages at lower of cost or market 12
Total residential mortgages 1,522 1,890
Other 120 395
Total $2,936 $3,492
We stopped originating certain commercial mortgage loans
designated as held for sale in 2008 and continue pursuing
opportunities to reduce these positions at appropriate prices.
We sold $25 million of these commercial mortgage loans held
for sale carried at fair value in 2011 and sold $241 million in
2010.
We recognized total net gains of $48 million in 2011 on the
valuation and sale of commercial mortgage loans held for sale,
net of hedges. Net losses of $18 million on the valuation and
sale of commercial mortgage loans held for sale, net of
hedges, were recognized in 2010.
Residential mortgage loan origination volume was $11.4
billion in 2011. Substantially all such loans were originated
under agency or Federal Housing Administration (FHA)
standards. We sold $11.9 billion of loans and recognized
related gains of $282 million during 2011. The comparable
amounts for 2010 were $10.0 billion and $231 million,
respectively.
Interest income on loans held for sale was $193 million in
2011. Comparable amounts for 2010 were $263 million. These
amounts are included in Other interest income on our
Consolidated Income Statement.
G
OODWILL AND
O
THER
I
NTANGIBLE
A
SSETS
Goodwill and other intangible assets totaled $10.1 billion at
December 31, 2011 and $10.8 billion at December 31, 2010.
Goodwill increased $.1 billion, to $8.3 billion, at
December 31, 2011 compared with the December 31, 2010
balance due to the BankAtlantic and Flagstar branch
acquisitions and the correction of amounts for an acquisition
affecting prior periods. The $.7 billion decline in other
intangible assets from December 31, 2010 included $.2 billion
and $.4 billion declines in commercial and residential
mortgage servicing rights, respectively. Note 9 Goodwill and
Other Intangible Assets included in the Notes To Consolidated
Financial Statements in Item 8 of this Report provides further
information on these items.
F
UNDING AND
C
APITAL
S
OURCES
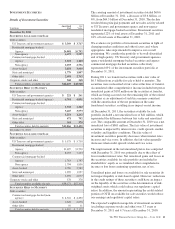
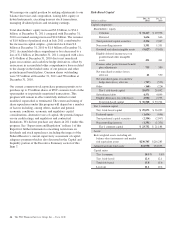
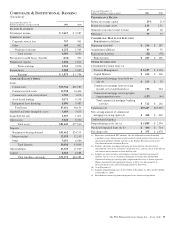
Details Of Funding Sources
In millions
Dec. 31
2011
Dec. 31
2010
Deposits
Money market $ 89,912 $ 84,581
Demand 57,717 50,069
Retail certificates of deposit 29,518 37,337
Savings 8,705 7,340
Other time 327 549
Time deposits in foreign offices 1,787 3,514
Total deposits 187,966 183,390
Borrowed funds
Federal funds purchased and repurchase
agreements 2,984 4,144
Federal Home Loan Bank borrowings 6,967 6,043
Bank notes and senior debt 11,793 12,904
Subordinated debt 8,321 9,842
Other 6,639 6,555
Total borrowed funds 36,704 39,488
Total $224,670 $222,878
Total funding sources increased $1.8 billion at December 31,
2011 compared with December 31, 2010.
Total deposits increased $4.6 billion, or 2%, at December 31,
2011 compared with December 31, 2010 due to an increase in
money market and demand deposits, partially offset by net
redemptions of retail certificates of deposit. Interest-bearing
deposits represented 69% of total deposits at December 31,
2011 compared to 73% at December 31, 2010. Total borrowed
funds decreased $2.8 billion since December 31, 2010. The
decline from December 31, 2010 was primarily due to
maturities of federal funds purchased and repurchase
agreements, bank notes and senior debt, and subordinated debt
partially offset by issuances of FHLB borrowings.
Capital
See Capital and Liquidity Actions in the Executive Summary
section of this Item 7 for additional information regarding our
December 2011 announcement that the Federal Reserve
approved the acquisition of RBC Bank (USA) and that the
OCC approved the merger of RBC Bank (USA) with and into
PNC Bank, N.A. with this transaction scheduled to close in
March 2012, our November 2011 redemption of trust
preferred securities, our September 2011 issuance of senior
notes, our July 2011 issuance of preferred stock, and our April
2011 increase to PNC’s quarterly common stock dividend.
The PNC Financial Services Group, Inc. – Form 10-K 45