PNC Bank 2011 Annual Report Download - page 137
Download and view the complete annual report
Please find page 137 of the 2011 PNC Bank annual report below. You can navigate through the pages in the report by either clicking on the pages listed below, or by using the keyword search tool below to find specific information within the annual report.-
 1
1 -
2
-
3
-
4
-
5
-
6
-
7
-
8
-
9
-
10
-
11
-
12
-
13
-
14
-
15
-
16
-
17
-
18
-
19
-
20
-
21
-
22
-
23
-
24
-
25
-
26
-
27
-
28
-
29
-
30
-
31
-
32
-
33
-
34
-
35
-
36
-
37
-
38
-
39
-
40
-
41
-
42
-
43
-
44
-
45
-
46
-
47
-
48
-
49
-
50
-
51
-
52
-
53
-
54
-
55
-
56
-
57
-
58
-
59
-
60
-
61
-
62
-
63
-
64
-
65
-
66
-
67
-
68
-
69
-
70
-
71
-
72
-
73
-
74
-
75
-
76
-
77
-
78
-
79
-
80
-
81
-
82
-
83
-
84
-
85
-
86
-
87
-
88
-
89
-
90
-
91
-
92
-
93
-
94
-
95
-
96
-
97
-
98
-
99
-
100
-
101
-
102
-
103
-
104
-
105
-
106
-
107
-
108
-
109
-
110
-
111
-
112
-
113
-
114
-
115
-
116
-
117
-
118
-
119
-
120
-
121
-
122
-
123
-
124
-
125
-
126
-
 127
127 -
 128
128 -
 129
129 -
 130
130 -
 131
131 -
 132
132 -
 133
133 -
 134
134 -
 135
135 -
 136
136 -
 137
137 -
 138
138 -
 139
139 -
 140
140 -
 141
141 -
 142
142 -
 143
143 -
 144
144 -
 145
145 -
 146
146 -
 147
147 -
148
-
149
-
150
-
151
-
152
-
153
-
154
-
155
-
156
-
157
-
158
-
159
-
160
-
161
-
162
-
163
-
164
-
165
-
166
-
167
-
168
-
169
-
170
-
171
-
172
-
173
-
174
-
175
-
176
-
177
-
178
-
179
-
180
-
181
-
182
-
183
-
184
-
185
-
186
-
187
-
188
-
189
-
190
-
191
-
192
-
193
-
194
-
195
-
196
-
197
-
198
-
199
-
200
-
201
-
202
-
203
-
204
-
205
-
206
-
207
-
208
-
209
-
210
-
211
-
212
-
213
-
214
-
215
-
216
-
217
-
218
-
219
-
220
-
221
-
222
-
223
-
224
-
225
-
226
-
227
-
228
-
229
-
230
-
231
-
232
-
233
-
234
-
235
-
236
-
237
-
238
 |
 |

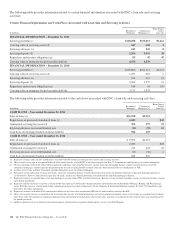
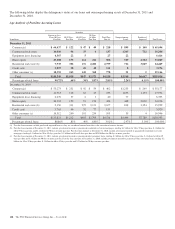
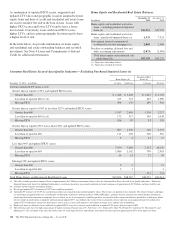
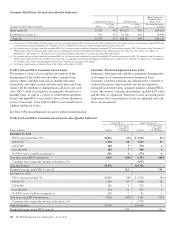
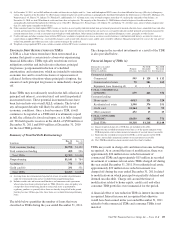
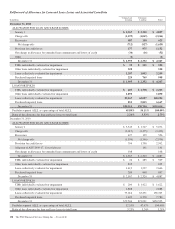
The following tables display the delinquency status of our loans and our nonperforming assets at December 31, 2011 and
December 31, 2010.
Age Analysis of Past Due Accruing Loans
Accruing
In millions
Current or Less
Than 30 Days
Past Due
30-59 Days
Past Due
60-89 Days
Past Due
90 Days
Or More
Past Due
Total Past
Due (a)
Nonperforming
Loans
Purchased
Impaired Total Loans
December 31, 2011
Commercial $ 64,437 $ 122 $ 47 $ 49 $ 218 $ 899 $ 140 $ 65,694
Commercial real estate 14,010 96 35 6 137 1,345 712 16,204
Equipment lease financing 6,367 22 5 27 22 6,416
Home equity 29,288 173 114 221 508 529 2,764 33,089
Residential real estate (b) 7,935 302 176 2,281 2,759 726 3,049 14,469
Credit card 3,857 38 25 48 111 8 3,976
Other consumer (c) 18,355 265 145 368 778 31 2 19,166
Total $144,249 $1,018 $547 $2,973 $4,538 $3,560 $6,667 $159,014
Percentage of total loans 90.72% .64% .34% 1.87% 2.85% 2.24% 4.19% 100.00%
December 31, 2010
Commercial $ 53,273 $ 251 $ 92 $ 59 $ 402 $1,253 $ 249 $ 55,177
Commercial real estate 14,713 128 62 43 233 1,835 1,153 17,934
Equipment lease financing 6,276 37 2 1 40 77 6,393
Home equity 30,334 159 91 174 424 448 3,020 34,226
Residential real estate (b) 9,150 331 225 2,121 2,677 818 3,354 15,999
Credit card 3,765 46 32 77 155 3,920
Other consumer (c) 16,312 260 101 234 595 35 4 16,946
Total $133,823 $1,212 $605 $2,709 $4,526 $4,466 $7,780 $150,595
Percentage of total loans 88.86% .81% .40% 1.80% 3.01% 2.97% 5.16% 100.00%
(a) Past due loan amounts exclude purchased impaired loans as they are considered current loans due to the accretion of interest income.
(b) Past due loan amounts at December 31, 2011, include government insured or guaranteed residential real estate mortgages, totaling $.1 billion for 30 to 59 days past due, $.1 billion for
60 to 89 days past due and $2.1 billion for 90 days or more past due. Past due loan amounts at December 31, 2010, include government insured or guaranteed residential real estate
mortgages, totaling $.1 billion for 30 to 59 days past due, $.1 billion for 60 to 89 days past due and $2.0 billion for 90 days or more past due.
(c) Past due loan amounts at December 31, 2011, include government insured or guaranteed other consumer loans, totaling $.2 billion for 30 to 59 days past due, $.1 billion for 60 to 89
days past due and $.3 billion for 90 days or more past due. Past due loan amounts at December 31, 2010, include government insured or guaranteed other consumer loans, totaling $.2
billion for 30 to 59 days past due, $.1 billion for 60 to 89 days past due and $.2 billion for 90 days or more past due.
128 The PNC Financial Services Group, Inc. – Form 10-K