Wells Fargo 2015 Annual Report Download - page 98
Download and view the complete annual report
Please find page 98 of the 2015 Wells Fargo annual report below. You can navigate through the pages in the report by either clicking on the pages listed below, or by using the keyword search tool below to find specific information within the annual report.-
 1
1 -
2
-
3
-
4
-
5
-
6
-
7
-
8
-
9
-
10
-
11
-
12
-
13
-
14
-
15
-
16
-
17
-
18
-
19
-
20
-
21
-
22
-
23
-
24
-
25
-
26
-
27
-
28
-
29
-
30
-
31
-
32
-
33
-
34
-
35
-
36
-
37
-
38
-
39
-
40
-
41
-
42
-
43
-
44
-
45
-
46
-
47
-
48
-
49
-
50
-
51
-
52
-
53
-
54
-
55
-
56
-
57
-
58
-
59
-
60
-
61
-
62
-
63
-
64
-
65
-
66
-
67
-
68
-
69
-
70
-
71
-
72
-
73
-
74
-
75
-
76
-
77
-
78
-
79
-
80
-
81
-
82
-
83
-
84
-
85
-
86
-
87
-
 88
88 -
 89
89 -
 90
90 -
 91
91 -
 92
92 -
 93
93 -
 94
94 -
 95
95 -
 96
96 -
 97
97 -
 98
98 -
 99
99 -
 100
100 -
 101
101 -
 102
102 -
 103
103 -
 104
104 -
 105
105 -
 106
106 -
 107
107 -
 108
108 -
109
-
110
-
111
-
112
-
113
-
114
-
115
-
116
-
117
-
118
-
119
-
120
-
121
-
122
-
123
-
124
-
125
-
126
-
127
-
128
-
129
-
130
-
131
-
132
-
133
-
134
-
135
-
136
-
137
-
138
-
139
-
140
-
141
-
142
-
143
-
144
-
145
-
146
-
147
-
148
-
149
-
150
-
151
-
152
-
153
-
154
-
155
-
156
-
157
-
158
-
159
-
160
-
161
-
162
-
163
-
164
-
165
-
166
-
167
-
168
-
169
-
170
-
171
-
172
-
173
-
174
-
175
-
176
-
177
-
178
-
179
-
180
-
181
-
182
-
183
-
184
-
185
-
186
-
187
-
188
-
189
-
190
-
191
-
192
-
193
-
194
-
195
-
196
-
197
-
198
-
199
-
200
-
201
-
202
-
203
-
204
-
205
-
206
-
207
-
208
-
209
-
210
-
211
-
212
-
213
-
214
-
215
-
216
-
217
-
218
-
219
-
220
-
221
-
222
-
223
-
224
-
225
-
226
-
227
-
228
-
229
-
230
-
231
-
232
-
233
-
234
-
235
-
236
-
237
-
238
-
239
-
240
-
241
-
242
-
243
-
244
-
245
-
246
-
247
-
248
-
249
-
250
-
251
-
252
-
253
-
254
-
255
-
256
-
257
-
258
-
259
-
260
-
261
-
262
-
263
-
264
-
265
-
266
-
267
-
268
-
269
-
270
-
271
-
272
-
273
 |
 |

Risk Management - Asset/Liability Management (continued)
SECURITIZATION DUE DILIGENCE AND RISK MONITORING The
market risk capital rule requires that the Company conduct due
diligence on the risk of each position within three days of the
purchase of a securitization position. The Company's due
diligence seeks to provide an understanding of the features that
would materially affect the performance of a securitization or re-
securitization. The due diligence analysis is re-performed on a
quarterly basis for each securitization and re-securitization
position. The Company uses an automated solution to track the
due diligence associated with securitization activity. The
Company aims to manage the risks associated with securitization
and re-securitization positions through the use of offsetting
positions and portfolio diversification.
Standardized Specific Risk Charge For debt and equity positions
that are not evaluated by the approved internal specific risk
models, a regulatory prescribed standard specific risk charge is
applied. The standard specific risk add-on for sovereign entities,
public sector entities, and depository institutions is based on the
Organization for Economic Co-operation and Development
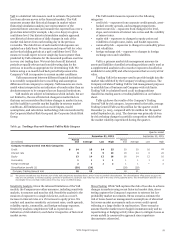
Table 47: Market Risk Regulatory Capital and RWAs
(OECD) country risk classifications (CRC) and the remaining
contractual maturity of the position. These risk add-ons for debt
positions range from 0.25% to 12%. The add-on for corporate
debt is based on creditworthiness and the remaining contractual
maturity of the position. All other types of debt positions are
subject to an 8% add-on. The standard specific risk add-on for
equity positions is generally 8%.
Comprehensive Risk Charge/Correlation Trading The market
risk capital rule requires capital for correlation trading positions.
The Company's remaining correlation trading exposure covered
under the market risk capital rule matured in fourth quarter
2014.
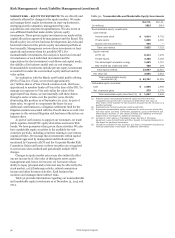
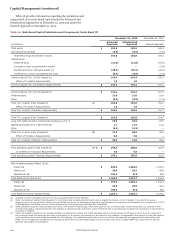
Table 47 summarizes the market risk-based capital
requirements charge and market RWAs in accordance with the
Basel III market risk capital rule as of December 31, 2015 and
2014. The market RWAs are calculated as the sum of the
components in the table below.
December 31, 2015 December 31, 2014
(in millions)
Risk-
based
capital
Risk-
weighted
assets
Risk-
based
capital
Risk-
weighted
assets
Total VaR $ 188 2,350 146 1,822
Total Stressed VaR 773 9,661 1,469 18,359
Incremental Risk Charge
Securitized Products Charge
Standardized Specific Risk Charge
De minimis Charges (positions not included in models)
309
616
1,048
19
3,864
7,695
13,097
243
345
766
1,177
66
4,317
9,577
14,709
829
Total $ 2,953 36,910 3,969 49,613
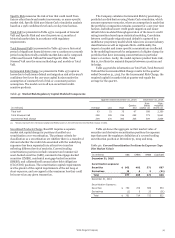
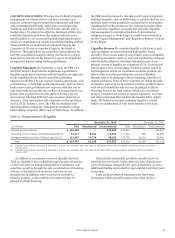
RWA Rollforward Table 48 depicts the changes in market risk
regulatory capital and RWAs under Basel III for the full year and
fourth quarter of 2015.
Table 48: Analysis of Changes in Market Risk Regulatory
Capital and RWAs
(in millions)
Balance, December 31, 2014
Total VaR
Total Stressed VaR
Incremental Risk Charge
Securitized Products Charge
Standardized Specific Risk Charge
De minimis Charges
Balance, December 31, 2015
$
$
Risk-
based
capital
3,969
42
(696)
(36)
(151)
(129)
(46)
2,953
Risk-
weighted
assets
49,613
528
(8,698)
(453)
(1,882)
(1,612)
(586)
36,910
Balance, September 30, 2015
Total VaR
Total Stressed VaR
Incremental Risk Charge
Securitized Products Charge
Standardized Specific Risk Charge
De minimis Charges
Balance, December 31, 2015
$
$
3,275
5
(73)
(69)
(79)
(99)
(7)
2,953
40,934
58
(910)
(857)
(984)
(1,243)
(88)
36,910
All changes to market risk regulatory capital and RWAs for the
full year and fourth quarter of 2015 were associated with
changes in positions due to normal trading activity in addition to
market volatility over the last year.
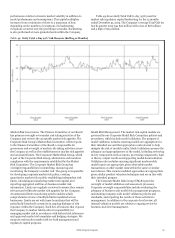
VaR Backtesting The market risk capital rule requires
backtesting as one form of validation of the VaR model.
Backtesting is a comparison of the daily VaR estimate with the
actual clean profit and loss (clean P&L) as defined by the market
risk capital rule. Clean P&L is the change in the value of the
Company’s covered trading positions that would have occurred
had previous end-of-day covered trading positions remained
unchanged (therefore, excluding fees, commissions, net interest
income, and intraday trading gains and losses). The backtesting
analysis compares the daily Total VaR for each of the trading
days in the preceding 12 months with the net clean P&L. Clean
P&L does not include credit adjustments and other activity not
representative of daily price changes driven by market risk
factors. The clean P&L measure of revenue is used to evaluate
the performance of the Total VaR and is not comparable to our
actual daily trading net revenues, as reported elsewhere in this
Report.
Any observed clean P&L loss in excess of the Total VaR is
considered a market risk regulatory capital backtesting
exception. The actual number of exceptions (that is, the number
of business days for which the clean P&L losses exceed the
corresponding 1-day, 99% Total VaR measure) over the
preceding 12 months is used to determine the capital multiplier
for the market risk capital calculation. The number of actual
backtesting exceptions is dependent on current market
Wells Fargo & Company
96