Wells Fargo 2015 Annual Report Download - page 55
Download and view the complete annual report
Please find page 55 of the 2015 Wells Fargo annual report below. You can navigate through the pages in the report by either clicking on the pages listed below, or by using the keyword search tool below to find specific information within the annual report.-
 1
1 -
2
-
3
-
4
-
5
-
6
-
7
-
8
-
9
-
10
-
11
-
12
-
13
-
14
-
15
-
16
-
17
-
18
-
19
-
20
-
21
-
22
-
23
-
24
-
25
-
26
-
27
-
28
-
29
-
30
-
31
-
32
-
33
-
34
-
35
-
36
-
37
-
38
-
39
-
40
-
41
-
42
-
43
-
44
-
 45
45 -
 46
46 -
 47
47 -
 48
48 -
 49
49 -
 50
50 -
 51
51 -
 52
52 -
 53
53 -
 54
54 -
 55
55 -
 56
56 -
 57
57 -
 58
58 -
 59
59 -
 60
60 -
 61
61 -
 62
62 -
 63
63 -
 64
64 -
 65
65 -
66
-
67
-
68
-
69
-
70
-
71
-
72
-
73
-
74
-
75
-
76
-
77
-
78
-
79
-
80
-
81
-
82
-
83
-
84
-
85
-
86
-
87
-
88
-
89
-
90
-
91
-
92
-
93
-
94
-
95
-
96
-
97
-
98
-
99
-
100
-
101
-
102
-
103
-
104
-
105
-
106
-
107
-
108
-
109
-
110
-
111
-
112
-
113
-
114
-
115
-
116
-
117
-
118
-
119
-
120
-
121
-
122
-
123
-
124
-
125
-
126
-
127
-
128
-
129
-
130
-
131
-
132
-
133
-
134
-
135
-
136
-
137
-
138
-
139
-
140
-
141
-
142
-
143
-
144
-
145
-
146
-
147
-
148
-
149
-
150
-
151
-
152
-
153
-
154
-
155
-
156
-
157
-
158
-
159
-
160
-
161
-
162
-
163
-
164
-
165
-
166
-
167
-
168
-
169
-
170
-
171
-
172
-
173
-
174
-
175
-
176
-
177
-
178
-
179
-
180
-
181
-
182
-
183
-
184
-
185
-
186
-
187
-
188
-
189
-
190
-
191
-
192
-
193
-
194
-
195
-
196
-
197
-
198
-
199
-
200
-
201
-
202
-
203
-
204
-
205
-
206
-
207
-
208
-
209
-
210
-
211
-
212
-
213
-
214
-
215
-
216
-
217
-
218
-
219
-
220
-
221
-
222
-
223
-
224
-
225
-
226
-
227
-
228
-
229
-
230
-
231
-
232
-
233
-
234
-
235
-
236
-
237
-
238
-
239
-
240
-
241
-
242
-
243
-
244
-
245
-
246
-
247
-
248
-
249
-
250
-
251
-
252
-
253
-
254
-
255
-
256
-
257
-
258
-
259
-
260
-
261
-
262
-
263
-
264
-
265
-
266
-
267
-
268
-
269
-
270
-
271
-
272
-
273
 |
 |

Balance Sheet Analysis
At December 31, 2015, our assets totaled $1.8 trillion, up
$100.5 billion from December 31, 2014. The predominant areas
of asset growth were in investment securities, which increased
$34.6 billion, and loans, which increased $54.0 billion
(including $11.5 billion from the GE Capital commercial real
estate loan purchase and related financing transaction that
settled in second quarter 2015). Federal funds sold and other
short-term investments, which increased $11.7 billion, combined
with deposit growth of $55.0 billion, an increase in short-term
borrowings of $34.0 billion, and total equity growth of
$8.6 billion from December 31, 2014, were the predominant
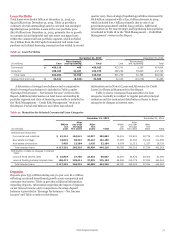
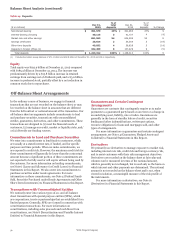
Investment Securities
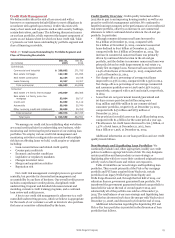
Table 10: Investment Securities – Summary
sources that funded our asset growth for 2015. Equity growth
was driven by $13.8 billion in retained earnings net of dividends
paid.
The following discussion provides additional information
about the major components of our balance sheet. Information
regarding our capital and changes in our asset mix is included in
the “Earnings Performance – Net Interest Income” and “Capital
Management” sections and Note 26 (Regulatory and Agency
Capital Requirements) to Financial Statements in this Report.
December 31, 2015 December 31, 2014
Net Net
Amortized unrealized Fair Amortized unrealized Fair
(in millions) Cost gain value Cost gain value
Available-for-sale securities:
Debt securities $ 263,318 2,403 265,721 247,747 6,019 253,766
Marketable equity securities 1,058 579 1,637 1,906 1,770 3,676
Total available-for-sale securities 264,376 2,982 267,358 249,653 7,789 257,442
Held-to-maturity debt securities 80,197 370 80,567 55,483 876 56,359
Total investment securities (1) $ 344,573 3,352 347,925 305,136 8,665 313,801
(1) Available-for-sale securities are carried on the balance sheet at fair value. Held-to-maturity securities are carried on the balance sheet at amortized cost.
Table 10 presents a summary of our investment securities
portfolio, which increased $34.6 billion from December 31, 2014,
primarily due to purchases of U.S. Treasury securities and
federal agency mortgage-backed securities. The total net
unrealized gains on available-for-sale securities were $3.0 billion
at December 31, 2015, down from $7.8 billion at December 31,
2014, primarily due to higher long-term interest rates, widening
credit spreads, and realized securities gains.
The size and composition of the investment securities
portfolio is largely dependent upon the Company’s liquidity and
interest rate risk management objectives. Our business generates
assets and liabilities, such as loans, deposits and long-term debt,
which have different maturities, yields, re-pricing, prepayment
characteristics and other provisions that expose us to interest
rate and liquidity risk. The available-for-sale securities portfolio
predominantly consists of liquid, high quality U.S. Treasury and
federal agency debt, agency mortgage-backed securities (MBS),
privately-issued residential and commercial MBS, securities
issued by U.S. states and political subdivisions, corporate debt
securities, and highly rated collateralized loan obligations. Due
to its highly liquid nature, the available-for-sale portfolio can be
used to meet funding needs that arise in the normal course of
business or due to market stress. Changes in our interest rate
risk profile may occur due to changes in overall economic or
market conditions, which could influence loan origination
demand, prepayment speeds, or deposit balances and mix. In
response, the available-for-sale securities portfolio can be
rebalanced to meet the Company’s interest rate risk
management objectives. In addition to meeting liquidity and
interest rate risk management objectives, the available-for-sale
securities portfolio may provide yield enhancement over other
short-term assets. See the “Risk Management – Asset/Liability
Management” section in this Report for more information on
liquidity and interest rate risk. The held-to-maturity securities
portfolio consists of high quality U.S. Treasury debt, securities
issued by U.S. states and political subdivisions, agency MBS,
asset-backed securities (ABS) primarily collateralized by auto
loans and leases, and collateralized loan obligations where our
intent is to hold these securities to maturity and collect the
contractual cash flows. The held-to-maturity portfolio may also
provide yield enhancement over short-term assets.
We analyze securities for other-than-temporary impairment
(OTTI) quarterly or more often if a potential loss-triggering
event occurs. Of the $559 million in OTTI write-downs
recognized in earnings in 2015, $183 million related to debt
securities and $2 million related to marketable equity securities,
which are each included in available-for-sale securities. Another
$374 million in OTTI write-downs were related to
nonmarketable equity investments, which are included in other
assets. OTTI write-downs recognized in earnings related to
energy investments totaled $287 million in 2015, of which
$104 million related to corporate debt investment securities, and
$183 million related to nonmarketable equity investments. For a
discussion of our OTTI accounting policies and underlying
considerations and analysis, see Note 1 (Summary of Significant
Accounting Policies) and Note 5 (Investment Securities) to
Financial Statements in this Report.
Wells Fargo & Company
53