Wells Fargo 2015 Annual Report Download - page 82
Download and view the complete annual report
Please find page 82 of the 2015 Wells Fargo annual report below. You can navigate through the pages in the report by either clicking on the pages listed below, or by using the keyword search tool below to find specific information within the annual report.-
 1
1 -
2
-
3
-
4
-
5
-
6
-
7
-
8
-
9
-
10
-
11
-
12
-
13
-
14
-
15
-
16
-
17
-
18
-
19
-
20
-
21
-
22
-
23
-
24
-
25
-
26
-
27
-
28
-
29
-
30
-
31
-
32
-
33
-
34
-
35
-
36
-
37
-
38
-
39
-
40
-
41
-
42
-
43
-
44
-
45
-
46
-
47
-
48
-
49
-
50
-
51
-
52
-
53
-
54
-
55
-
56
-
57
-
58
-
59
-
60
-
61
-
62
-
63
-
64
-
65
-
66
-
67
-
68
-
69
-
70
-
71
-
 72
72 -
 73
73 -
 74
74 -
 75
75 -
 76
76 -
 77
77 -
 78
78 -
 79
79 -
 80
80 -
 81
81 -
 82
82 -
 83
83 -
 84
84 -
 85
85 -
 86
86 -
 87
87 -
 88
88 -
 89
89 -
 90
90 -
 91
91 -
 92
92 -
93
-
94
-
95
-
96
-
97
-
98
-
99
-
100
-
101
-
102
-
103
-
104
-
105
-
106
-
107
-
108
-
109
-
110
-
111
-
112
-
113
-
114
-
115
-
116
-
117
-
118
-
119
-
120
-
121
-
122
-
123
-
124
-
125
-
126
-
127
-
128
-
129
-
130
-
131
-
132
-
133
-
134
-
135
-
136
-
137
-
138
-
139
-
140
-
141
-
142
-
143
-
144
-
145
-
146
-
147
-
148
-
149
-
150
-
151
-
152
-
153
-
154
-
155
-
156
-
157
-
158
-
159
-
160
-
161
-
162
-
163
-
164
-
165
-
166
-
167
-
168
-
169
-
170
-
171
-
172
-
173
-
174
-
175
-
176
-
177
-
178
-
179
-
180
-
181
-
182
-
183
-
184
-
185
-
186
-
187
-
188
-
189
-
190
-
191
-
192
-
193
-
194
-
195
-
196
-
197
-
198
-
199
-
200
-
201
-
202
-
203
-
204
-
205
-
206
-
207
-
208
-
209
-
210
-
211
-
212
-
213
-
214
-
215
-
216
-
217
-
218
-
219
-
220
-
221
-
222
-
223
-
224
-
225
-
226
-
227
-
228
-
229
-
230
-
231
-
232
-
233
-
234
-
235
-
236
-
237
-
238
-
239
-
240
-
241
-
242
-
243
-
244
-
245
-
246
-
247
-
248
-
249
-
250
-
251
-
252
-
253
-
254
-
255
-
256
-
257
-
258
-
259
-
260
-
261
-
262
-
263
-
264
-
265
-
266
-
267
-
268
-
269
-
270
-
271
-
272
-
273
 |
 |

Risk Management – Credit Risk Management (continued)
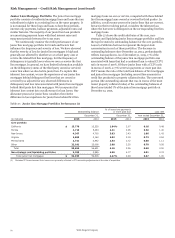
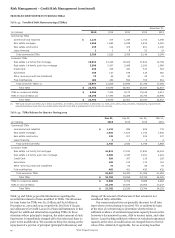
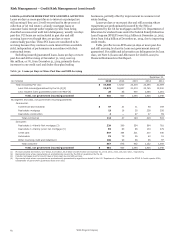
TROUBLED DEBT RESTRUCTURINGS (TDRs)
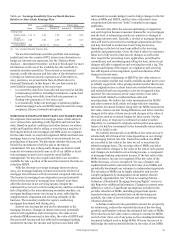
Table 33: Troubled Debt Restructurings (TDRs)
December 31,
(in millions) 2015 2014 2013 2012 2011
Commercial TDRs
Commercial and industrial $ 1,123 724 1,034 1,700 2,046
Real estate mortgage 1,456 1,880 2,248 2,625 2,262
Real estate construction 125 314 475 801 1,008
Lease financing 1 2 8 20 33
Total commercial TDRs 2,705 2,920 3,765 5,146 5,349
Consumer TDRs
Real estate 1-4 family first mortgage 16,812 18,226 18,925 17,804 13,799
Real estate 1-4 family junior lien mortgage 2,306 2,437 2,468 2,390 1,986
Credit Card 299 338 431 531 593
Automobile 105 127 189 314 260
Other revolving credit and installment 73 49 33 24 19
Trial modifications 402 452 650 705 651
Total consumer TDRs (1) 19,997 21,629 22,696 21,768 17,308
Total TDRs $ 22,702 24,549 26,461 26,914 22,657
TDRs on nonaccrual status $ 6,506 7,104 8,172 10,149 6,811
TDRs on accrual status (1) 16,196 17,445 18,289 16,765 15,846
Total TDRs $ 22,702 24,549 26,461 26,914 22,657
(1) TDR loans include $1.8 billion, $2.1 billion, $2.5 billion, $1.9 billion, and $318 million at December 31, 2015, 2014, 2013, 2012, and 2011, respectively, of government
insured/guaranteed loans that are predominantly insured by the FHA or guaranteed by the VA and are accruing.
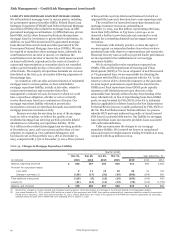
Table 34: TDRs Balance by Quarter During 2015
Dec 31, Sep 30, Jun 30, Mar 31,
(in millions) 2015 2015 2015 2015
Commercial TDRs
Commercial and industrial $ 1,123 999 808 779
Real estate mortgage 1,456 1,623 1,740 1,838
Real estate construction 125 207 236 247
Lease financing 1 1 2 2
Total commercial TDRs 2,705 2,830 2,786 2,866
Consumer TDRs
Real estate 1-4 family first mortgage 16,812 17,193 17,692 18,003
Real estate 1-4 family junior lien mortgage 2,306 2,336 2,381 2,424
Credit Card 299 307 315 326
Automobile 105 109 112 124
Other revolving credit and installment 73 63 58 54
Trial modifications 402 421 450 432
Total consumer TDRs 19,997 20,429 21,008 21,363
Total TDRs $ 22,702 23,259 23,794 24,229
TDRs on nonaccrual status $ 6,506 6,709 6,889 6,982
TDRs on accrual status 16,196 16,550 16,905 17,247
Total TDRs $ 22,702 23,259 23,794 24,229
Table 33 and Table 34 provide information regarding the
recorded investment of loans modified in TDRs. The allowance
for loan losses for TDRs was $2.7 billion and $3.6 billion at
December 31, 2015 and 2014, respectively. See Note 6 (Loans
and Allowance for Credit Losses) to Financial Statements in this
Report for additional information regarding TDRs. In those
situations where principal is forgiven, the entire amount of such
forgiveness is immediately charged off to the extent not done so
prior to the modification. We sometimes delay the timing on the
repayment of a portion of principal (principal forbearance) and
charge off the amount of forbearance if that amount is not
considered fully collectible.
Our nonaccrual policies are generally the same for all loan
types when a restructuring is involved. We re-underwrite loans
at the time of restructuring to determine whether there is
sufficient evidence of sustained repayment capacity based on the
borrower’s documented income, debt to income ratios, and other
factors. Loans lacking sufficient evidence of sustained repayment
capacity at the time of modification are charged down to the fair
value of the collateral, if applicable. For an accruing loan that
Wells Fargo & Company
80